Between November 2014 and March 2016, a total of 178 DECT scans of the neck were performed, 66 of which in patients with primary HNSCC. Other pathologies included thyroid cancer and lymphoma (n=35), infection (n=22), post-treatment HNSCC (n=24) and benign lesions (n=32).
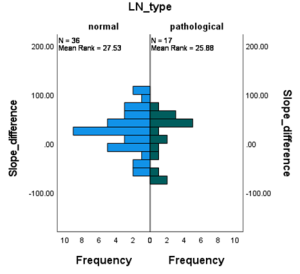
Out of the 66 patients with HNSCC, 38 had either a hypopharyngeal (n=6) or laryngeal (n=32) tumor. Four patients were excluded from the analysis due to the absence of pathologically confirmed malignancy (n=1), primary tumor size <0.1 cm3 (n=2), and missing spectral data (n=1), leaving 34 patients for the final analysis. A total of 69 measurable LNs (36 normal, 17 pathological, and 16 suspicious) were included. Another two patients were excluded from the analysis due to the absence of measurable LN.
Patients ages ranged from 49 to 89 years, with a mean age of 69 years. At the time of analysis, 26 patients had died. Death between the diagnosis and death ranged from less than one year to seven years, with a mean overall survival of 1.8 years. Thirteen patients were scanned using the Siemens Somatom Flash with 80/140kVp, and 21 patients were scanned using the Siemens Somatom Force system with 80/150kVp tube currents.
Primary tumor volume varied between 0.2 and 50.40 cm3 with a mean of 7.2 cm2 (SD 9.99).
Comparisons of normalized IC, 40-50-60keV HU-values, iodine density and Rho/Z values between normal and pathological LN showed no significant differences: U=293.00 (p=.804), U=290.00 (p=.760), U=275.00 (p=.555), U=269.00 (p=.481), U=283.500 (p=.668) and U=313.00 (p=.894). Similarly, no significant difference was found in k40-100keV ratio with U=287.00 (p=.717).