1. Introduction
CS is a rare but potentially fatal manifestation of systemic sarcoidosis and remains a leading cause of death in affected patients. Although clinical cardiac involvement occurs in 3-5% of cases, autopsy findings show CS in up to 20-30%, highlighting the challenge of diagnosing it during life. Consequently, recent advancements in imaging techniques, particularly cardiac MRI and 18F-FDG PET/CT, have improved diagnostic accuracy, overcoming the limited sensitivity of myocardial biopsy. Furthermore, hybrid PET/MRI offers a synergistic method to assess both inflammatory and fibrotic stages of CS, enabling better diagnostic precision and disease management.
This presentation will review the clinical characteristics and diagnostic criteria of CS, focusing on the critical role of advanced imaging. Additionally, we will explore how these imaging tools aid in assessing the risk of sudden cardiac death and monitoring treatment responses.
2. Clinical manifestations
CS can be asymptomatic; however, when symptoms are present, they commonly include chest pain, palpitations, dyspnea, and syncope, though these are nonspecific.
Cardiac manifestations can be categorized into three main groups:
- Arrhythmic: atrioventricular block, bundle branch block, supraventricular tachycardia, ventricular tachycardia, and, in severe cases, sudden cardiac death.
- Cardiomyopathic:
- Heart failure, either due to left ventricular systolic dysfunction or preserved ejection fraction.
- Restrictive cardiomyopathy.
- Right ventricular failure, often secondary to pulmonary involvement.
- Pericardial: pericarditis.
While no specific clinical signs reliably predict sudden cardiac death, left ventricular ejection fraction (LVEF) remains the most important prognostic indicator of mortality in patients with CS.
3. Diagnosis
Diagnosing CS remains a significant challenge, particularly in the early stages, where timely intervention can significantly improve outcomes. Although endomyocardial biopsy has traditionally been the "gold standard", its low sensitivity (~30%) and its patchy granuloma distribution limit its effectiveness.
Several diagnostic guidelines exist for CS, with the 2016 Japanese Circulation Society (JCS) guidelines being the most widely accepted. These emphasize the role of advanced imaging techniques like cardiac MRI and 18F-FDG PET/CT, reducing the reliance on histological confirmation. This shift allows for earlier and more accurate diagnoses, even without systemic sarcoidosis. As a result, diagnosing CS requires a multidisciplinary approach, combining clinical, radiological, and pathological expertise.
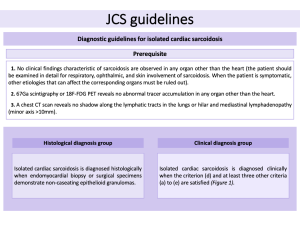
3.1. JCS guidelines
The JCS guidelines have updated the diagnostic criteria for CS, emphasizing the role of advanced imaging. LGE on MRI and positive 18F-FDG PET are now key diagnostic tools. The diagnosis is categorized into two groups:
- Histological diagnosis: confirmed when non-caseating epithelioid granulomas are identified in myocardial biopsy or surgical samples.
- Clinical diagnosis, based on:
- Granulomas in other organs and clinical signs indicating cardiac involvement.
- Signs of pulmonary or ophthalmic sarcoidosis with at least two characteristic laboratory findings, along with clinical evidence of heart involvement.
The updated JCS guidelines also specifically address "isolated CS", where granulomas are present only in the heart, without involvement of other organs. This inclusion highlights LGE on MRI as a key diagnostic criterion for identifying CS in such cases.

4. Imaging features
4.1. Cardiac MRI
Cardiac MRI is an essential non-invasive tool for evaluating suspected CS, offering high spatial, temporal, and tissue resolution to assess cardiac anatomy, function, myocardial edema, and fibrosis. Although no single feature is pathognomonic for CS, LGE is a key indicator of disease severity and progression.
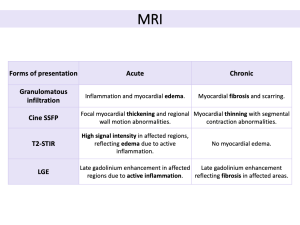
The MRI protocol for CS includes:
- Cine SSFP (steady-state free precession): evaluates cardiac anatomy and function, detecting morphological abnormalities like ventricular aneurysms, left ventricular wall thinning, left ventricular dilation, and focal myocardial hypertrophy.
- T2-weighted short-tau inversion recovery (T2-STIR): sarcoid infiltrates appear as intramyocardial focal zones with increased signal intensity due to edema from inflammation. For assessing disease activity, combining 18F-FDG PET/CT improves accuracy.
- LGE: LGE on MRI identifies edema, fibrosis, scar tissue, and necrosis, all of which are crucial for tissue characterization. Common patterns include sub-epicardial and mid-wall LGE along the basal septum and/or inferolateral wall, frequently involving the right ventricular insertion points, in a non-ischemic distribution. The extent of LGE is an independent predictor of cardiovascular events and mortality, and its location can guide endomyocardial biopsy. A reduction in LGE following immunosuppressive therapy may indicate treatment efficacy.
- T1/T2 Mapping: prolonged T1 and T2 values in sarcoidosis patients can assess disease activity and response to therapy, potentially offering a quantitative method for monitoring treatment.
 Fig 3: Cardiac sarcoidosis MRI protocol, highlighting the main sequences and their diagnostic applications.
 Fig 4: (A) Cardiac sarcoidosis predominantly affects the basal segments of the heart. (B) Diagram illustrating common patterns of late gadolinium enhancement, including subepicardial, midmyocardial, transmural, and patchy distributions.
 Fig 5: Different patterns of late gadolinium enhancement in cardiac sarcoidosis, categorized by probability: possible, probable, highly probable, and advanced disease.
 Fig 6: Cardiac sarcoidosis with systolic heart failure in a 58-year-old male with a history of pulmonary sarcoidosis, presenting with tachycardia and dyspnea. Cardiac MRI revealed an LVEF of 36%, with phase-sensitive inversion recovery (PSIR) sequences in four-chamber (A) and short-axis (B) views demonstrating midmyocardial and subepicardial LGE in the inferior wall and mid-basal septum, extending into the right ventricle.
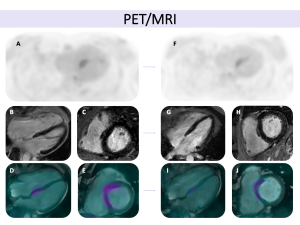
 Fig 8: Cardiac sarcoidosis in a 37-year-old male with systemic sarcoidosis involving the lungs, kidneys, and liver, presenting with dyspnea and palpitations. Cardiac MRI demonstrated an LVEF of 42% with global hypokinesia. Phase-sensitive inversion recovery (PSIR) sequences in four-chamber (A) and short-axis (B, C) views revealed localized late gadolinium enhancement in the mid-ventricular septal and inferior apical segments, following a non-ischemic pattern and extending to the right ventricular free wall. T1 and T2 mapping sequences showed increased T1 and T2 relaxation times in the inferoseptal mid-apical region, consistent with localized fibrosis and associated myocardial edema, suggestive of active inflammation. Hybrid PET-MRI imaging showed increased FDG uptake in the apical segments, further confirming active cardiac sarcoidosis.
 Fig 9: Key aspects to assess in cardiac MRI for the evaluation of cardiac sarcoidosis (adapted from the JSC 2016 guidelines).
CS presents in two distinct stages (acute and chronic), each characterized by different imaging features.
4.2. 18F-FDG PET/CT
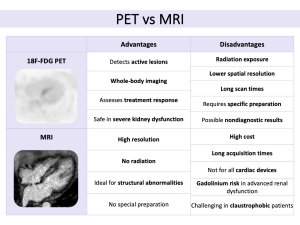
18F-FDG PET/CT is a crucial imaging modality for detecting myocardial inflammation. FDG, a glucose analog, highlights areas of high metabolic activity typical of granulomas. One challenge with 18F-FDG PET is that normal myocardial cells also utilize glucose, potentially leading to false positives. To reduce this risk, appropriate patient preparation, including fasting or a high-fat, low-carbohydrate diet, is essential.
For an accurate diagnosis, 18F-FDG PET/CT should be combined with a resting perfusion scan (99mTc SPECT or 82Rb PET/CT), allowing for the detection of both active inflammation and myocardial scarring. Several uptake patterns have been identified, and by integrating 18F-FDG PET/CT with perfusion data, CS can be classified into categories such as normal, early-stage, progressive, or fibrotic disease.

Moreover, focal 18F-FDG uptake, especially in the right ventricle, can indicate inflammation in this area, a key marker of disease severity, which is associated with a worse prognosis, including higher risks of ventricular tachycardia and sudden cardiac death. Finally, 18F-FDG PET/CT is useful not only for diagnosing CS but also for monitoring the response to immunosuppressive treatment, providing insight into active inflammation and monitoring disease progression over time.
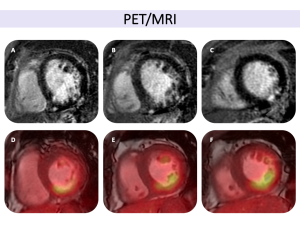
4.3. Integrated PET/MRI
The integration of PET and MRI in diagnosing and managing CS has advanced significantly in recent years. The hybrid PET/MRI system combines MRI's anatomical and tissue characterization with PET's molecular imaging, providing a comprehensive view of the disease. Studies have shown that hybrid imaging offers better sensitivity and specificity than either modality alone.
Cardiac MRI, particularly with LGE, excels in visualizing myocardial fibrosis and scarring, common in advanced CS. PET, using 18F-FDG, highlights active inflammation in macrophages associated with granulomas. These complementary features enable clinicians to differentiate between active and chronic stages of CS. Early on, MRI detects myocardial edema and inflammation, while PET reveals metabolic activity in areas with developing granulomas. As the disease progresses, MRI identifies fibrosis, and PET shows reduced activity as inflammation subsides. This integrated approach helps clinicians monitor progression and assess treatment response. Recent studies suggest that hybrid PET/MRI imaging outperforms conventional methods in predicting adverse cardiovascular events.
Overall, hybrid PET/MRI represents a significant advance in non-invasive diagnostic tools for CS, enabling more precise risk stratification, better monitoring, and improved therapeutic decisions. Further research is needed, especially in large-scale studies, but this hybrid modality shows promise as a potential standard for managing CS.

5. Differential diagnosis
Diagnosing CS can be challenging due to its overlapping imaging features with other cardiovascular conditions. Accurate diagnosis requires careful integration of clinical and imaging findings.
