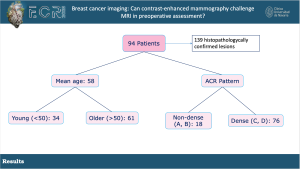
Demographics: A total of 139 histopathologically confirmed lesions from 94 women were included. The mean age of the patients was 58, with 34 women in the young subgroup (<50 years old) and 61 in the old subgroup (≥50). The distribution of ACR classification groups was 18 patients conforming to non-dense breasts (A and B) and 76 patients in dense breasts (C and D) subgroups.
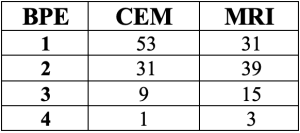
Background Parenchymal Enhancement (BPE): MRI demonstrated a higher degree of BPE compared to CEM, with median values of 2 vs 1 respectively, which showed a statistically significant (p=0.001) difference.
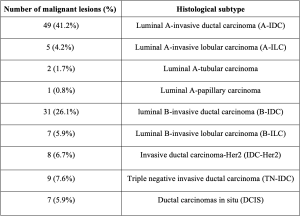
Histologically, 23 benign and 116 malignant lesions were identified. Among the malignant lesions, 49 Luminal A-invasive ductal carcinoma (A-IDC), 31 luminal B-invasive ductal carcinoma (B-IDC), and 9 triple negative invasive ductal carcinoma (TN-IDC) were described.
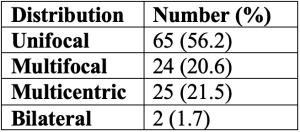
Distribution of the malignant lesions: 65 were classified as unifocal, 25 as multicentric, 24 as multifocal and 2 as bilateral.
Lesion classification for each technique: MRI showed 18 FP and 4 FN and CEM, 1 FP and 22 FN.
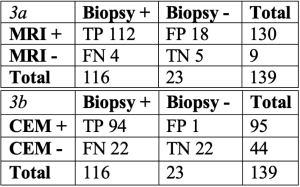
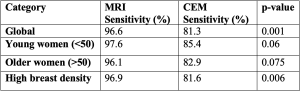
The global sensitivity to detect breast cancer was 96.6% for breast MRI vs 81,03% for CEM (p=0.001). Subgroup analysis:
- Age: a sensitivity of 97.6% for MRI vs 85.4% for CEM (p=0.06) in young women and a sensitivity of 96.1% for MRI vs 82.9% for CEM (p=0.075) in the old women group.
- Breast density: a sensitivity of 96.9% for MRI vs 81.6% for CEM in the high-density subgroup (p=0.006) was found, showing a higher sensitivity of MRI vs CEM with a general tendency to statistical significance.
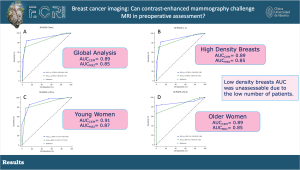
ROC curves show an AUC of 0.85 for MRI and 0.89 for CEM in the global analysis. Subgroup analysis:
-AUC of 0.85 for MRI and 0.89 for CEM in the high-density breast subgroup
-AUC of 0.87 for MRI and 0.91 for CEM in the young subgroup
-AUC of 0.85 for MRI and 0.89 for CEM in the old women group.
Low-density breasts AUC was unassessable due to the low number of patients.
No significant differences were found between any of the aforementioned groups.
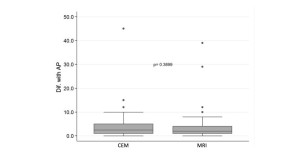
The box plots showed the discrepancies between size measurements performed on MRI or CEM and the measurements performed by pathologists on surgical specimens (n=78).
The mean differences for MRI and CEM were +3.35 and +4.04 mm respectively, finding no significant differences in the tumor size assessment (p=0.389), with a tendency to lesion size overestimation.
Among the histology of the FN in each technique, MRI failed to detect 4 lesions (1 DCIS and 3 Luminal-A). On the other hand, CEM failed to detect a total of 22 tumors, including 5 DCIS (one of them measuring 45 mm), 8 Luminal A, and 9 Luminal B. Both techniques detected all Her 2 and TN carcinomas.

Results are currently under review, pending for publication.