1. Definition
In 2010, the European Working Group on Sarcopenia in Older People (EWGSOP) established a clinical definition of sarcopenia, characterizing it as a syndrome involving progressive and generalized loss of skeletal muscle mass and strength, associated with adverse outcomes. [1] Diagnosis requires the presence of both low muscle mass and low muscle function (strength or performance). [1] Recognizing advancements in the field, EWGSOP updated its definition in 2018 (EWGSOP2), emphasizing low muscle strength as the primary indicator of sarcopenia and classifying it as a muscle disease (muscle failure) rooted in adverse muscle changes that accumulate over a lifetime. [2]
The EWGSOP2 diagnostic algorithm involves screening for low muscle strength, confirming the diagnosis with evidence of low muscle quantity or quality (assessable via imaging), and classifying severity based on the presence of low physical performance. [1]
2. Imaging modalities for the evaluation of sarcopenia
Computed tomography (CT)
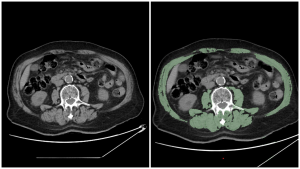
Sarcopenia assessment on CT exams is done by measuring the skeletal muscle index (SMI). SMI is calculated as skeletal muscle area (SMA) at the L3 vertebra level divided by height squared (SMA/height²).
The muscles typically evaluated for sarcopenia assessment at the L3 vertebra:
- Psoas Major
- Quadratus Lumborum
- Rectus Abdominis
- Transversus Abdominis
- Erector Spinae
- External Oblique Muscle
- Internal Oblique Muscle
To separate muscles from other tissues for sarcopenia evaluation, several methods can be used:
- Manual or semi-automated segmentation: this involves manually or semi-automatically outlining the muscles of interest on each image slice. The outlined area represents the skeletal muscle area (SMA).
- Image analysis software: specialized software is used to quantify muscle SMA and density (Hounsfield Units on CT) on abdominal CT scans. For example, one method involves segmenting all muscle on an axial image,with the software set to include tissue between -29 and 150 HU.
There is currently no universal consensus on the cut-off values for diagnosing sarcopenia using CT across different studies and populations. A systematic review indicated that many studies utilize cut-off values for skeletal muscle index (SMI), ranging between 40 and 50 cm²/m² (60.5% of the studies reviewed reported using these ranges). [3]
Given that CT scans are frequently performed for diagnostic purposes in patients with pancreatic cancer and chronic pancreatitis, they offer a convenient opportunity to also assess and monitor sarcopenia.
Magnetic Resonance Imaging (MRI)
MRI stands out as a comprehensive imaging modality for assessing sarcopenia due to its ability to provide detailed insights into both the quantity and quality of muscle tissue. MRI is considered the most sophisticated imaging technique for characterizing the loss of muscle quality, as manifested by abnormal edema, adipose tissue (myosteatosis), and fibrous connective tissue (myofibrosis). [4] Classical MRI protocols include T1-weighted imaging and Dixon techniques to assess muscle volume and fat infiltration. Water T2 rise and T2 heterogeneity could be linked to the alteration of fiber type. [5]

Dual-energy X-ray absorptiometry (DEXA)
DEXA evaluates sarcopenia by quantifying fat mass, lean mass, and bone mineral content, and monitors changes in body composition with high reproducibility. [6] In clinical settings it is used for the analysis of the appendicular lean mass index (ALMI), calculated as ALM/height² (kg/m²).
EWGSOP2 recommends specific cut-off points for diagnosing sarcopenia using DEXA. For diagnosing low muscle mass, the recommended cut-offs are:
- Men: <7.0 kg/m²
- Women: <5.4 kg/m²
These values are crucial for identifying individuals with sarcopenia, as they indicate low muscle mass in relation to height.
3. Clinical relevance
Pancreatic Cancer: While sarcopenia prevalence in pancreatic cancer varies widely due to differing patient populations and measurement methods, it consistently leads to poorer surgical outcomes, decreased chemotherapy tolerance, and reduced overall survival rates. [7][8]
Chronic Pancreatitis: Affecting roughly 32% of patients, sarcopenia in chronic pancreatitis is linked to reduced quality of life, increased hospitalizations, and a higher risk of one-year mortality, with CT scans serving as the primary assessment tool. [9]
4. Future directions
Given the widespread use of cross-sectional imaging in patients with pancreatic diseases, implementing AI-driven tools to automate sarcopenia assessment from existing CT or MRI scans offers a significant opportunity to improve risk stratification and personalize treatment strategies.
Furthermore, incorporating advanced MRI techniques can provide enhanced insights into muscle quality, complementing traditional muscle mass measurements and potentially refining diagnostic accuracy.
Future research should also focus on establishing widely accepted, standardized cut-off values for sarcopenia assessment, as there is significant variability in current practices.