Findings and procedure details
Mucormycosis demonstrates a wide imaging spectrum depending on the site of involvement, with clinical manifestations closely paralleling disease extent. At selected unusual sites of involvement, radiologic findings were confirmed by histopathological examination, establishing the diagnosis of mucormycosis.
Rhino-orbito-cerebral mucormycosis
Rhino-orbito-cerebral mucormycosis (ROCM) is the most common form of mucormycosis. Infection typically originates in the nasal cavity or paranasal sinuses following inhalation of spores and rapidly progresses via direct extension through osseous structures, skull base foramina, and along vascular and neural pathways, leading to orbital and intracranial involvement.
Patients commonly present with facial swelling, fever, and nasal congestion, while advanced disease manifests with proptosis, nasal discharge, facial pain, headache, and cranial nerve palsies, reflecting extrasinus extension and neurovascular involvement (1).
Invasive fungal rhinosinusitis
Invasive fungal rhinosinusitis represents the earliest and most common manifestation of rhino-orbito-cerebral mucormycosis. Imaging findings may be subtle in early disease, with mucosal thickening and nonspecific sinus opacification. Contrast-enhanced MRI is particularly valuable for detecting devitalized mucosa, characterized by lack of enhancement (“black turbinate sign”), which reflects tissue necrosis (2).
Fig 2: Clinical history: A 60-year-old diabetic male presents with unilateral nasal obstruction and facial pain.
Figures A & B: Coronal T2-weighted and T1-weighted MRI images demonstrate marked T2 hypointensity with corresponding T1 hypointensity involving the left nasal cavity and turbinates (yellow arrows). In contrast, the right nasal cavity shows a normal mucosal signal with T2 hyperintensity and T1 hypointensity (orange arrows).
Figure C: Coronal post-contrast T1-weighted MRI image demonstrates complete absence of mucosal enhancement in the left nasal cavity and turbinates (green arrow), consistent with nonviable mucosa (black turbinate sign). The contralateral side shows uniform mucosal enhancement (blue arrow).
Figure D: Histopathology with Grocott methenamine silver (GMS) stain demonstrates nasal mucous glands (red arrow) containing broad, pauciseptate fungal hyphae (purple arrow), consistent with mucormycosis.
Extrasinonasal spread
Extrasinonasal invasion is suggested by infiltration of adjacent soft tissues, periantral fat stranding, bone erosion, and loss of contrast enhancement. Normally, periantral fat shows fat attenuation on CT and high signal on MRI; loss of these features indicates invasive disease. Side-to-side comparison helps detect subtle changes. Importantly, invasive fungal rhinosinusitis may extend beyond the sinuses without overt bony destruction via perivascular or perineural spread (1,3).
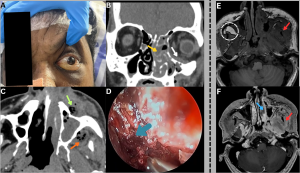
Fig 3: Case 1 -
Clinical history:
A 58-year-old diabetic male presented with progressive left facial swelling and orbital discomfort.
Figure A:
Clinical photograph demonstrates left periorbital swelling and proptosis with overlying blackish skin discoloration involving the infraorbital region.
Figure B:
Coronal CT of the paranasal sinuses demonstrates mucosal thickening and soft-tissue attenuation within the left maxillary sinus and ethmoid air cells (yellow arrow), with extension into the inferior extraconal orbit (white arrow).
Figure C:
Axial CT of the paranasal sinuses demonstrates ill-defined hypodense soft tissue with internal air foci and perifocal fat stranding in the left premaxillary (green arrow) and retroantral regions (orange arrow), indicating extrasinus extension.
Figure D:
Nasal endoscopic image demonstrates necrotic nasal mucosa (blue arrow).
......Case 2 -
Clinical history:
A 45-year-old male presented with nasal obstruction and ear fullness.
Figure E:
Axial T1-weighted MRI image demonstrates an ill-defined T1 hypointense area involving the left infratemporal fossa (red arrow) and obliteration of the left retroantral fat (compare with normal fat in the dotted circle).
Figure F:
Axial post-contrast T1-weighted MRI image demonstrates abnormal enhancement in the left infratemporal fossa (red arrow) with patchy nonenhancement of the left middle turbinate (blue arrow), consistent with devitalized mucosa.
Intraorbital Extension
Intraorbital extension most commonly arises from the ethmoid sinuses via direct invasion, angioinvasion, perineural spread, or contiguous osteomyelitis. Imaging features include orbital fat stranding, ill-defined inflammatory soft tissue, abnormal enhancement, proptosis, displacement of orbital structures, and optic neuritis. Angioinvasion may lead to ischemic optic neuropathy manifested by diffusion restriction and loss of contrast enhancement (1,3).
Fig 4: Clinical history:
A 62-year-old diabetic male presented with rapidly progressive left periorbital swelling, vision loss, and ophthalmoplegia.
Figures A & B:
Axial and coronal T2-weighted MRI images demonstrate mucosal thickening within the left ethmoid and maxillary sinuses (orange arrows), with ill-defined T2/FLAIR hyperintensity and fat stranding in the left orbital fat (white arrows), consistent with orbital extension.
Figure C:
Axial T2-weighted MRI image demonstrates post-enucleation changes of the left globe (green arrow).
Figure D:
Histopathology demonstrates broad, pauciseptate fungal hyphae infiltrating the retina (black arrow), confirming mucormycosis.
Cavernous sinus extension
As venous drainage from the ethmoid sinuses communicates with the cavernous sinus, mucormycosis carries a high risk of cavernous sinus involvement. Imaging findings include cavernous sinus enlargement with bulging lateral walls, abnormal signal intensity, and thrombosis. Isolated sphenoid sinusitis is a potential source of cavernous sinus extension and should be routinely evaluated (1,3).
Fig 5: Clinical history:
A 48-year-old male with invasive sinonasal mucormycosis presented with acute right-sided medial deviation of the globe and worsening periocular pain.
Figure A:
Axial T2-weighted MRI image demonstrates mucosal thickening within the bilateral ethmoid air cells along with enlargement of the right medial rectus muscle (green arrow), resulting in medial deviation of the right globe (red arrows).
Figure B:
Axial post-contrast T1-weighted MRI image demonstrates intense enhancement of the right medial rectus muscle (green arrow) with extension toward and encasement of the cavernous sinus regions (blue arrows). Both internal carotid arteries show preserved contrast opacification.
Figures C & D:
Axial pre- and post-contrast T1-weighted MRI images demonstrate a well-defined T1 hypointense lesion within the left medial rectus muscle, showing post-contrast enhancement (orange arrows), compatible with early fungal infiltration.
Fig 6: Clinical history:
A 50-year-old diabetic male presented with severe retro-orbital pain, ptosis, and cranial nerve palsies.
Figure A:
Axial T2-weighted MRI image demonstrates mucosal thickening within the bilateral ethmoid air cells (green arrows).
Figure B:
Coronal T2-weighted MRI image demonstrates T2 hyperintense soft tissue within the left cavernous sinus (orange arrow).
Figure C:
Axial post-contrast T1-weighted MRI image demonstrates absent contrast opacification of the left cavernous sinus (red arrow), consistent with cavernous sinus thrombosis. The right cavernous sinus shows normal contrast opacification (white arrow).
Fig 7: Clinical history:
A 60-year-old diabetic female presented with a headache and acute neurological deficit.
Figures A & B:
Axial post-contrast T1-weighted MRI images demonstrate nonopacification of the C3–C4 segments of the right internal carotid artery (red arrows) with adjacent enhancing soft tissue at the skull base (green arrow), consistent with skull-base involvement and vascular compromise.
Figure C:
Axial diffusion-weighted imaging (DWI) demonstrates multiple diffusion-restricting foci in the right frontal lobe and centrum semiovale (yellow arrow), consistent with acute ischemic infarcts secondary to internal carotid artery involvement.
Intra-cranial extension
Intracranial extension of mucormycosis occurs via the orbital fissures or skull base foramina. Cerebral involvement may manifest as skull base osteomyelitis, pachymeningitis, extradural abscess, focal cerebritis, or cerebral abscess.
Fig 8: Clinical history:
A 55-year-old diabetic male presented with severe occipital headache, dysphagia, and left-sided otalgia.
Figure A:
Axial CT image of the skull base demonstrates ill-defined soft-tissue density involving the left petrous apex with anterior extension toward the posterior pharyngeal wall (white arrows).
Figure B:
CT bone window image demonstrates erosive changes of the left petrous apex (green arrow). Associated soft-tissue attenuation is noted within the left mastoid air cells (red arrow), likely reflecting eustachian tube obstruction.
Figure C:
Axial contrast-enhanced CT (CECT) image demonstrates heterogeneously enhancing soft tissue involving the left petrous apex with extension into the posterior pharyngeal wall (orange arrows).
Figure D:
Histopathology demonstrates necrotic tissue (black arrow) containing broad, pauci-septate fungal hyphae (blue arrow), consistent with mucormycosis.
Fig 9: Clinical history:
A 52-year-old diabetic male presented with new-onset seizures and altered sensorium.
Figures A & B:
Axial diffusion-weighted imaging (DWI) and apparent diffusion coefficient (ADC) images demonstrate a diffusion-hyperintense focus without corresponding ADC hypointensity in the right temporal lobe (green arrow).
Figures C & D:
Axial T1- and T2-weighted MRI images demonstrate corresponding T1 hypointensity (yellow arrow) and T2 hyperintensity (white arrow) in the right temporal lobe, consistent with cerebritis. Associated T1 hypointense and T2 hyperintense soft-tissue thickening within the right ethmoid air cells (red arrows) suggests concurrent sinonasal involvement, representing a potential source of intracranial spread.
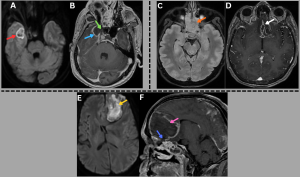
Fig 10: Cases 1–3: Intracranial Abscesses....
Case 1 -
A 48-year-old male with uncontrolled diabetes mellitus and recent corticosteroid use presented with fever, headache, and altered sensorium.
Axial diffusion-weighted imaging (DWI) and apparent diffusion coefficient (ADC) images (A), along with a post-contrast T1-weighted MRI image (B), demonstrate a diffusion-restricting abscess in the right temporal lobe (red arrow) with peripheral rim enhancement (blue arrow) and a central nonenhancing core, showing direct continuity with adjacent sinusitis (green arrow).
..........Case 2 -
A middle-aged male with uncontrolled diabetes mellitus and recent corticosteroid use presented with fever, headache, and altered sensorium.
Axial T2/FLAIR MRI image (C) demonstrates near-complete opacification of the ethmoid sinuses (orange arrow). Axial post-contrast T1-weighted MRI image (D) demonstrates a peripherally enhancing subdural collection along the anterior falx with additional enhancing collections in the basifrontal region (white arrow).
...........Case 3 -
A 48-year-old diabetic male presented with fever, headache, and new-onset behavioral changes.
Axial DWI image (E) and sagittal post-contrast T1-weighted MRI image (F) demonstrate a diffusionrestricting abscess in the left frontal lobe (yellow arrow) with peripheral rim enhancement and a central nonenhancing core (pink arrow), showing direct extension from ethmoidal sinusitis (blue arrow).
Cranial nerve involvement appears as abnormal thickening and enhancement with obliteration of normal foraminal fat, most commonly affecting the trigeminal nerve.
Fig 11: Clinical history:
A 55-year-old diabetic male presented with facial numbness, visual blurring, and acute-onset gait imbalance.
Figures A–C:
Axial diffusion-weighted imaging (DWI), apparent diffusion coefficient (ADC), and FLAIR images demonstrate diffusion restriction with corresponding T2/FLAIR hyperintensity involving the right trigeminal nerve (red arrows), consistent with trigeminal neuritis. Additionally, acute infarcts are noted in the right cerebellar hemisphere, showing DWI hyperintensity with corresponding ADC hypointensity and FLAIR hyperintensity (green arrows).
Figures D–F:
Axial DWI, ADC, and FLAIR images demonstrate diffusion restriction with associated T2/FLAIR hyperintensity involving the right optic nerve (white arrows), consistent with optic neuritis.
Fig 12: Clinical history:
A 58-year-old diabetic male presented with progressive visual loss, facial numbness, and cranial nerve deficits.
Figure A:
Axial FLAIR MRI image demonstrates T2/FLAIR hyperintensity involving the posterior aspects of the optic tracts, optic chiasm, and optic radiations (red arrows).
Figure B:
Axial post-contrast T1-weighted MRI image demonstrates peripheral enhancement along the posterior aspects of both optic nerves (orange arrows), supporting perineural involvement in invasive fungal infection.
Figure C:
Axial FLAIR MRI image demonstrates T2/FLAIR hyperintensity within the pons, predominantly at the trigeminal nerve root entry zones, more pronounced on the right (green arrows).
Figure D:
Axial post-contrast T1-weighted MRI image demonstrates peripheral enhancement of the bilateral trigeminal nerves involving their cisternal segments and Meckel’s caves, consistent with perineural extension of mucormycosis.
Vascular involvement results from direct endothelial injury and intraluminal growth of fungal hyphae, leading to pseudoaneurysms, thrombosis or emboli, and distal cerebral infarcts (1,3,4).
Fig 13: Clinical history:
A 56-year-old diabetic male with known invasive fungal sinusitis presented with sudden-onset severe headache, vomiting, and altered consciousness.
Figure A:
Axial post-contrast T1-weighted MRI image demonstrates heterogeneously enhancing soft tissue extending from the left ethmoid air cells into the left orbit (red arrow).
Figure B:
Axial non-contrast CT brain image demonstrates acute subarachnoid hemorrhage predominantly involving the basal cisterns (orange arrow).
Figure C:
Axial contrast-enhanced CT (CECT) brain image demonstrates a well-defined contrast-filled outpouching in the left prepontine cistern (green arrow), suspicious for an intracranial aneurysm.
Figure D:
Reconstructed CT angiographic image demonstrates a saccular aneurysm arising from the left superior cerebellar artery (white arrow).
Pulmonary mucormycosis
Pulmonary mucormycosis occurs following inhalation of fungal spores and predominantly affects immunocompromised patients. Because clinical features overlap with other pulmonary infections, imaging findings play a critical role in patient management.
Imaging features
In early pulmonary mucormycosis, CT may demonstrate subtle perivascular ground-glass opacities, which often precede more extensive disease. These lesions commonly evolve into consolidation, nodules, or masses, sometimes surrounded by a ground-glass halo ("halo sign"), a nonspecific finding. A "reverse halo sign", central ground-glass opacity surrounded by peripheral consolidation, has been described as a relatively specific imaging feature of pulmonary mucormycosis.
Fig 14: Case 1 -
Clinical history:
A 45-year-old patient with poorly controlled diabetes mellitus presented with fever, cough, and pleuritic chest pain.
Figure A:
Erect AP chest radiograph demonstrates multiple inhomogeneous air-space opacities in the bilateral lung fields (green arrows).
Figures B and C:
Coronal and axial HRCT images demonstrate multiple lesions with central ground-glass attenuation surrounded by a peripheral rim of consolidation in both lungs (red arrows), consistent with the reverse halo sign.
.......Case 2 -
Clinical history:
A 50-year-old immunocompromised male presented with acute febrile illness and hemoptysis.
Figures D and E:
Axial and coronal HRCT images demonstrate multifocal areas of consolidation with surrounding peripheral ground-glass attenuation (orange arrows), representing the halo sign. Additional ill-defined ground-glass opacities are noted in the bilateral lung fields (blue arrows).
Vascular involvement leads to pulmonary infarction, and parenchymal necrosis is common, resulting in consolidation or mass-like lesions with a centrally hypodense, nonenhancing component and a relative paucity of air bronchograms, termed the "hypodense nodule sign". This finding may precede cavitation, although cavitation can occasionally be the initial imaging manifestation.
Fig 15: Clinical history:
A 42-year-old patient with diabetic ketoacidosis presented with persistent fever and dry cough.
Figure A:
Axial HRCT chest image demonstrates a focal area of consolidation in the superior basal segment of the right lower lobe (orange arrow).
Figures B and C:
Axial non-contrast and post-contrast CT chest images demonstrate a central low-attenuation, nonenhancing focus within the consolidation (green arrows), consistent with the hypodense nodule sign.
Figures D and E:
Axial and sagittal post-contrast CT chest images demonstrate abrupt cut-off and nonvisualization of an adjacent segmental/subsegmental pulmonary arterial branch (red arrows), consistent with the vascular cut-off sign, reflecting underlying vascular involvement in invasive pulmonary mucormycosis.
Fig 16: Clinical history:
A 48-year-old male with post-COVID mucormycosis presented with a worsening cough.
Figures A & B:
Axial and coronal HRCT chest images demonstrate multiple discrete consolidative nodules with peripheral ground-glass halos (green arrows).
Figures C & D:
Follow-up HRCT chest performed 2 months later demonstrates cavitary transformation of the lesions with dependent soft-tissue content (red arrows), indicating interval disease progression.
Vascular involvement may appear as pseudoaneurysm formation or abrupt truncation of a pulmonary arterial branch ("vascular cutoff sign") (5–8).
Fig 17: Clinical history:
A 35-year-old male with a history of severe COVID-19 presented to the emergency department with fever, breathlessness, and massive hemoptysis.
Figure A:
Axial CT pulmonary angiography (CTPA) image demonstrates cavitary consolidation in the right upper lobe with a pseudoaneurysm arising from the posterior segmental branch of the right pulmonary artery (red arrow).
Figure B:
Three-dimensional volume-rendered reconstruction highlights the pulmonary artery pseudoaneurysm (white arrow).
Figures C & D:
Selective pulmonary angiograms confirm a pseudoaneurysm arising from the posterior segmental branch supplying the right upper lobe (black arrows).
Figure E:
Post-glue embolization angiogram demonstrates complete occlusion of the pseudoaneurysm (green arrow).
Microbiology: Bronchoalveolar lavage culture and sputum microscopy confirmed pulmonary mucormycosis.
Fig 18: Clinical history:
A 36-year-old immunocompromised female with a history of renal transplantation on long-term immunosuppressive therapy presents with fever, cough, and hemoptysis.
Figure A:
High-resolution CT (HRCT) chest image demonstrates consolidation in the right middle and lower lobes (red arrow) with associated centrilobular ground-glass nodules.
Figures B & C:
Axial and coronal contrast-enhanced CT (CECT) chest images demonstrate aneurysmal dilatation of the right interlobar pulmonary artery (green arrow) with an associated intimal flap (orange arrow), consistent with a dissecting pulmonary artery aneurysm.
Figure D:
Histopathology demonstrates necrotic lung parenchyma with alveolar spaces (blue arrow). The magnified view reveals broad, pauciseptate fungal hyphae (black arrow), confirming mucormycosis.
Rare complications such as mediastinal abscess and gastropleural fistula may occur due to aggressive invasive spread (9,10).
Fig 19: Clinical history:
A 58-year-old immunocompromised male presented with fever, retrosternal chest pain, and progressive dysphagia.
Figure A:
Axial CT chest image demonstrates multiple ill-defined hypodense lesions within the mediastinum (red arrow).
Figures B & C:
Axial and coronal post-contrast CT chest images demonstrate peripheral rim enhancement with central nonenhancing areas (yellow arrows), consistent with mediastinal abscesses. No definite air–fluid levels are identified.
Figure D:
CT-guided aspiration, followed by a KOH mount, demonstrates broad, aseptate hyphae, confirming mucormycosis.
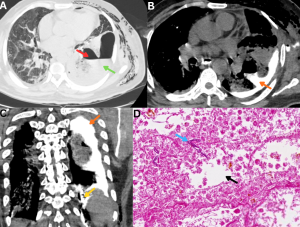
Fig 20: Clinical history:
A 47-year-old diabetic male with pulmonary mucormycosis presented with severe left-sided chest pain.
Figure A:
Axial HRCT chest image demonstrates a thick-walled parenchymal cavity in the left lower lobe (red arrow) with direct communication with the adjacent pleural space (green arrow).
Figure B:
Axial CT chest image obtained following oral administration of positive contrast demonstrates contrast layering within the pleural cavity, with tracking into the pre-existing parenchymal cavity (orange arrow), confirming abnormal communication.
Figure C:
Coronal CT image demonstrates a well-defined tract of oral contrast extending from the gastric lumen (yellow arrow) across the diaphragm into the pleural cavity (orange arrow), establishing the diagnosis of a gastopleural fistula, a rare but severe complication of invasive mucormycosis.
Figure D:
Histopathology demonstrates necrotic lung parenchyma with alveolar spaces (black arrow) containing broad, pauciseptate fungal hyphae (blue arrow), consistent with mucormycosis.
Solid organ mucormycosis
Hepatic and splenic mucormycosis are relatively uncommon manifestations of disseminated disease and often present with nonspecific clinical features. Imaging typically demonstrates multiple small hypodense lesions consistent with microabscesses, reflecting hematogenous spread. These lesions may involve the liver and spleen simultaneously (11, 12).
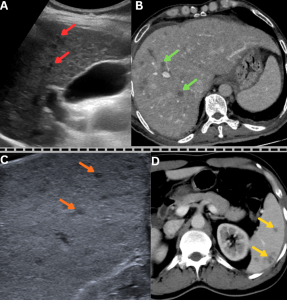
Fig 21: Case 1 -
Clinical history:
A middle-aged male with uncontrolled diabetes mellitus and recent corticosteroid exposure, a diagnosed case of disseminated mucormycosis, presented with fever and sepsis.
Figures A & B:
Figure A: Magnified ultrasound image demonstrates multiple hypoechoic lesions in the liver (red arrows).
Figure B: Axial contrast-enhanced CT (CECT) abdomen image demonstrates multiple hypodense, hypoenhancing lesions in the liver (green arrows), consistent with hepatic microabscesses.
......Case 2 -
Clinical history:
A diabetic male with recent COVID-19 infection and corticosteroid exposure, a diagnosed case of disseminated mucormycosis, presented with persistent fever and abdominal pain.
Figures C & D:
Figure C: Magnified ultrasound image demonstrates multiple hypoechoic lesions in the spleen (orange arrows).
Figure D: Axial contrast-enhanced CT (CECT) abdomen image demonstrates multiple hypodense, hypoenhancing lesions in the spleen (yellow arrows), consistent with splenic microabscesses.
Splenic infarcts appear as wedge-shaped hypodense areas with absent or reduced enhancement. These infarcts may be isolated or occur as part of disseminated disease (13).
Renal involvement represents another manifestation of disseminated mucormycosis. Contrast-enhanced CT typically demonstrates diffuse or patchy areas of absent or reduced renal parenchymal enhancement, reflecting infarction. Associated findings may include thickening of Gerota’s fascia, perinephric fat stranding, renal abscesses or perinephric collections, bulky adjacent psoas muscle, and reactive pleural effusion (14).
Fig 22: Clinical history:
A known case of disseminated mucormycosis presented with abdominal pain, fever, and acute kidney injury.
Figure A:
Axial HRCT chest image demonstrates both the halo sign (blue arrow) and reverse halo sign (red arrow), consistent with invasive pulmonary fungal infection.
Figures B & C:
Axial and coronal contrast-enhanced CT (CECT) abdomen images demonstrate nonenhancement of the left kidney (green arrow) with severe paucity of contrast opacification in the left renal artery (white arrow). Multiple wedge-shaped nonenhancing areas are noted in the right kidney (yellow arrows), consistent with bilateral renal infarctions. An additional wedge-shaped nonenhancing area is seen in the inferior pole of the spleen (orange arrow), consistent with splenic infarction.
Fig 23: Clinical history:
An uncontrolled diabetic male presented with fever and flank pain.
Figures A–C:
Coronal and axial contrast-enhanced CT images demonstrate an ill-defined, heterogeneously enhancing soft-tissue mass completely replacing the right kidney (blue arrows), consistent with extensive renal involvement.
Histopathology: Histopathological examination confirmed the diagnosis of renal mucormycosis.
Gastrointestinal mucormycosis
Gastrointestinal mucormycosis may occur as a primary infection following ingestion of contaminated food or use of contaminated instruments, or as a secondary manifestation due to hematogenous spread in disseminated disease. Patients typically present with abdominal pain and gastrointestinal bleeding, often associated with ulceration. The stomach is the most involved site, followed by the colon, small intestine, and esophagus (15).
Imaging findings
Stomach
Gastric pneumatosis with reduced or absent wall enhancement, reflecting transmural ischemia and necrosis due to fungal angioinvasion. Air may extend into the short gastric vessels or gastrosplenic ligament, with possible perigastric collections. Gastric wall thickening with focal necrosis or perforation may also be seen.
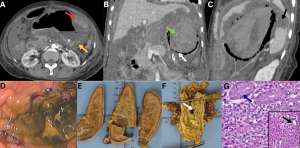
Fig 24: Clinical history:
A 52-year-old immunocompromised male presented with acute abdominal pain, hematemesis, and shock.
Figure A:
Axial contrast-enhanced CT (CECT) abdomen image demonstrates diffuse gastric submucosal edema with mucosal hyperenhancement (yellow arrow) and areas of intramural hemorrhage (red arrow).
Figure B:
Coronal CECT abdomen image demonstrates intraluminal gastric hemorrhage (green arrow) with intramural air foci and absent enhancement of the gastric fundus (white arrow), confirming extensive gastric necrosis with perforation.
Figure C:
Sagittal CECT abdomen image demonstrates a nonenhancing area in the spleen (black arrow), consistent with splenic infarction.
Figure D:
Endoscopic image demonstrates extensive necrosis of the gastric mucosa.
Figures E & F (Gross specimens):
Gross pathological specimens of the spleen and stomach demonstrate splenic infarction and gastric wall necrosis with perforation (white arrow), respectively.
Figure G:
Histopathology (H&E stain) from the gastric biopsy demonstrates gastric glands (blue arrow). The magnified view reveals infiltration by broad, pauciseptate fungal hyphae (black arrow), confirming mucormycosis.
Small Bowel
Diffuse bowel dilatation with segmental or patchy wall thickening and altered enhancement, most commonly decreased. Sharply demarcated non-enhancing segments or loss of wall definition indicate infarction. A "target sign" due to submucosal edema may occur. Progressive disease can lead to necrosis, perforation, and perienteric collections.
Fig 25: Clinical history:
A 38-year-old immunocompromised patient presented with abdominal pain and vomiting.
Figures A–C:
Axial, coronal, and sagittal contrast-enhanced CT (CECT) abdomen images demonstrate marked circumferential wall thickening of the jejunal and ileal loops (yellow arrows), consistent with small-bowel involvement.
Figure D:
Histopathology demonstrates necrotic small-bowel wall with muscle fibers (black arrows) infiltrated by broad, pauciseptate fungal hyphae (blue arrow), confirming mucormycosis.
Colon: Focal or diffuse wall thickening with reduced enhancement, pericolonic fat stranding, and fluid. Advanced disease may show colonic pneumatosis, focal wall non-visualization, pericolic collections, or mass-like mural thickening (16).
Miscellaneous
Cutaneous Mucormycosis
Cutaneous mucormycosis is an uncommon form of the disease that occurs following disruption of the skin barrier due to burns, trauma, maceration, or instrumentation and has been reported at insulin injection sites, catheter insertion sites, and areas of medical device fixation. Clinically, it may present as a necrotic eschar with surrounding erythema and induration. On CT, findings include skin and subcutaneous soft tissue thickening with ill-defined margins, fat stranding, and heterogeneous or reduced enhancement; advanced disease may demonstrate nonenhancing necrotic areas, collections, or gas. Lymph node involvement is uncommon and usually reflects locoregional spread. Imaging may demonstrate enlarged or necrotic lymph nodes with reduced or absent enhancement.
Fig 26: Clinical history:
A 49-year-old immunocompromised male presented with painful neck swelling and a non-healing ulcer over the lateral neck.
Figure A:
Axial contrast-enhanced CT (CECT) neck image demonstrates diffuse subcutaneous fat stranding (green arrow) with focal irregularity of the overlying skin and subcutaneous tissues (yellow arrow).
Figure B:
Sagittal CECT neck image demonstrates an enlarged, homogeneously enhancing cervical lymph node (red arrow).
Figure C:
Histopathology from the cutaneous ulcer demonstrates foamy macrophages (blue arrow) with broad, aseptate fungal hyphae showing right-angle branching (black arrow), consistent with mucormycosis.
Figure D:
Histopathology from the cervical lymph node demonstrates extensive necrosis with fungal hyphae (dark blue arrow), confirming nodal involvement.
Fig 27: Clinical history:
An uncontrolled diabetic male presented with a painful penile ulcer.
Figure A:
Clinical photograph demonstrates an indurated ulcer with slough involving the glans penis.
Figure B:
Axial CT pelvis image demonstrates soft-tissue thickening with air foci involving the penis (red arrow).
Figure C:
Histopathology from the penile biopsy demonstrates corpora spongiosum (black arrow) infiltrated by aseptate fungal hyphae with right-angle branching (blue arrow), consistent with mucormycosis.
Figure D:
Follow-up clinical photograph demonstrates complete resolution of the ulcer following surgical debridement and liposomal amphotericin B therapy.
Oral cavity involvement, including lingual mucormycosis, may present as tongue ulceration or discoloration reflecting tissue necrosis.
Fig 28: Clinical history:
A 45-year-old immunocompromised male presented with painful tongue swelling and ulceration.
Figures A & B:
Sagittal T2/FLAIR and T1-weighted MRI images demonstrate an ill-defined area of altered signal intensity along the ventral surface of the tongue, appearing hyperintense on T2/FLAIR with mild T1 hyperintensity (green arrows).
Figure C:
Sagittal post-contrast T1-weighted MRI image demonstrates peripheral rim enhancement with central nonenhancement (red arrow).
Figure D:
Histopathology demonstrates skeletal muscle fibers (black arrow) infiltrated by broad, pauciseptate fungal hyphae (blue arrow), confirming mucormycosis.
Non–Skull Base Osteomyelitis
Osseous involvement occurs due to contiguous spread or hematogenous dissemination and represents advanced disease, manifesting as fungal osteomyelitis (17–20).
Fig 29: Clinical history:
A 57-year-old immunocompromised male presented with rapidly progressive perineal swelling, ulceration, blackish discoloration of the penile skin, and back pain.
Figure A:
Axial CT pelvis image demonstrates diffuse subcutaneous fat stranding with multiple air foci involving the penile shaft (red arrow), scrotum, and adjacent perineal soft tissues (green arrows).
Figure B:
Axial CT pelvis image demonstrates air foci within the sacral bone (yellow arrows), consistent with sacral osteomyelitis, with additional air noted in the bilateral iliacus muscles (pink arrow).
Figure C:
Histopathology (H&E stain) from the sacral bone biopsy demonstrates bony trabeculae (black arrow).
Figure D:
Magnified image demonstrates broad, pauciseptate fungal hyphae (blue arrow), confirming mucormycosis.
Imaging Considerations
Across organ systems, mucormycosis demonstrates a characteristic imaging pattern dominated by loss of normal tissue enhancement, vascular occlusion, and perfusion abnormalities rather than purely inflammatory change. Contrast-enhanced CT is the first-line modality for rapid assessment of disease extent, vascular involvement, solid-organ or bowel ischemia, and complications such as hemorrhage, infarction, or pseudoaneurysm formation. Contrast-enhanced MRI with diffusion-weighted imaging is particularly valuable for orbital, skull-base, neural, and intracranial involvement, where early diffusion restriction or nonenhancement may precede overt structural destruction. Careful evaluation of enhancement patterns, side-to-side comparison, and a systematic search for multifocal disease are essential, as subtle findings may represent early, rapidly progressive infection.
Fig 30: Summary of radiological manifestations of mucormycosis across multiple organ systems.