Findings
TBS and bone protection treatment
16% (n=16/99) had degraded microarchitecture on TBS despite having normal or osteopenic BMD on DEXA. These findings suggest that TBS identifies an additional cohort of patients who could potentially benefit from bone protection treatment, despite not reaching treatment threshold with DEXA T-score alone.
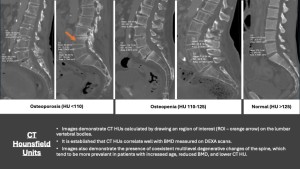
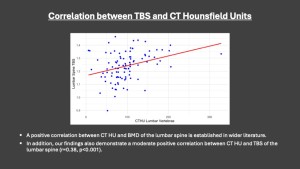
TBS and CT Hounsfield Units
There is a positive correlation between TBS and CT HUs of lumbar vertebrae (r=0.39, p<0.001). CT is a readily available imaging modality that offers an alternative approach to assess bone strength. CT HU is a reliable correlate for BMD, and there are suggestions of correlation of CT HUs with bone trabecular microarchitecture. It can be used in cases where DEXA is unavailable, inconclusive or contraindicated such as extremely low or high BMI. CTs performed for other indications may incidentally identify patients at risk of osteoporosis, and recommendations made for DEXA or initiation of bone protection treatment.
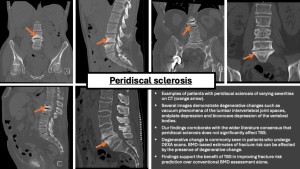
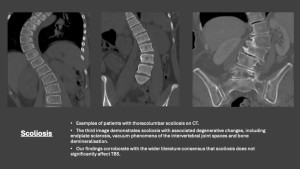
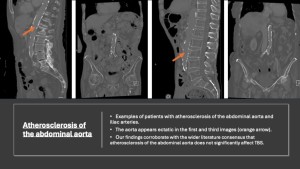
Effect of peridiscal sclerosis, scoliosis and atherosclerosis on TBS
There was no significant effect of TBS-adjusted T-scores in patients with peridiscal sclerosis (n=68, p=0.14), scoliosis (n= 20, p=0.60) and atherosclerosis (n= 58, p=0.79). Even in moderate to severe peridiscal sclerosis (n=58, p=0.09) and moderate to severe scoliosis (n=11, p=0.07), a non-significant difference of TBS-adjusted T-scores was observed.
The wider literature supports our findings of a non-significant impact of degenerative changes and atherosclerosis on TBS[6]. Furthermore, some studies indicate that BMD is more susceptible to degenerative changes compared to TBS[7]. This implies that TBS may serve as a more reliable measure of fracture risk in the presence of specific degenerative changes than BMD.