Background
Bone strength and osteoporotic fracture risk
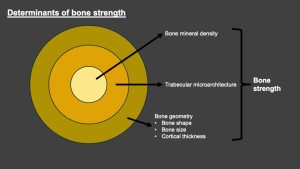
Bone mineral density (BMD) and trabecular microarchitecture are key determinants of bone strength. Most fragility fractures occur in individuals with normal BMD or osteopenia, highlighting the limitations of relying on BMD alone in predicting fracture risk[1].
Osteoporotic fractures pose significant morbidity, mortality and healthcare costs. Comprehensive and accurate assessment of bone strength is therefore a public health priority. Early diagnosis, prevention and prompt treatment of individuals at risk of osteoporotic fractures are key.
DEXA and TBS
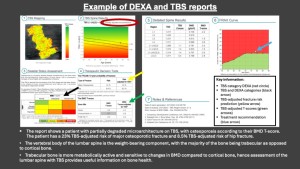
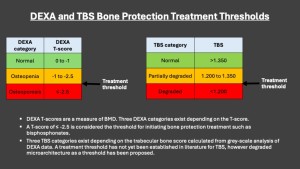
Dual-energy X-ray absorptiometry (DEXA) is the current gold standard for diagnosing and assessing the effectiveness of bone protection treatment in patients with osteoporosis. DEXA measures BMD, which is expressed by a T-score. T-scores reflect the difference between the individual’s BMD from that of an average young and healthy person of the same sex. Based on T-score, BMD is classified into one of three categories: normal, osteopenia and osteoporosis.
TBS is a grey-scale analytical tool derived from DEXA data which improves osteoporotic fracture risk prediction, independent of BMD[2]. TBS assesses bone trabecular microarchitecture. A higher TBS score indicates stronger trabecular microarchitecture. It is classified into normal, partially degraded and degraded.
Bone protection treatment thresholds
A DEXA T-score of -2.5 or lower is widely used to diagnose osteoporosis and is considered the threshold for initiating bone protection. However, there is growing recognition of the necessity to incorporate additional analytical tools like TBS to improve fracture risk prediction. While there is currently no established consensus on treatment thresholds for TBS, degraded TBS has been proposed as a potential cut-off.
Factors affecting DEXA T-scores
Spinal degenerative changes and atherosclerosis are common in older patients. Both factors can falsely increase BMD estimates and lead to falsely elevated T scores[3]. It is therefore thought that peridiscal sclerosis, scoliosis and atherosclerosis may also influence TBS-adjusted fracture risk prediction. CT allows excellent assessment for the presence of all three factors. Additionally, measurement of Hounsfield Units of vertebral bodies of the lumbar spine on CT is a reliable indicator osteoporosis[4]. TBS may also correlate with HUs[5].
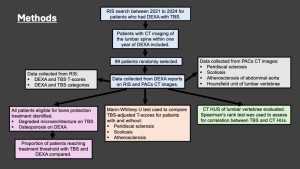
Methods
This was a single-centre retrospective study. The study included 99 patients who underwent DEXA with TBS between 2021 to 2024 and had CTs of their lumbar spine within a year of the DEXA. This included CTs performed for any indication which imaged the lumbar spine, such as CT abdomen and pelvis, CT whole spine, CT whole aorta, etc. Data was collected from RIS and PACs.
Patients with degraded microarchitecture on TBS or osteoporosis on DEXA were considered eligible for bone protection treatment. The proportion of patients recommended bone protection based on TBS alone were compared to those who would qualify for treatment based on their DEXA T-scores. TBS adjusted T-scores were compared between patients with and without peridiscal sclerosis, scoliosis and atherosclerosis using Mann-Whitney U test. CT images were used to assess for the presence of these conditions, with stratification of normal, mild or moderate/severe. CT HUs of lumbar vertebral bodies were calculated. Spearman’s rank test was used to assess for correlation between TBS and CT HUs.