The embryological development of the biliary tract is a complex process closely related to the vascular and parenchymal development of the hepatobiliary system. The ductal plate is the essential structure for biliary tract development; hence, it is crucial to understand the pathologies that can occur as a result of its malformation.
These malformations can lead to a spectrum of diseases known as polycystic liver diseases, primarily affecting the intrahepatic biliary tract. However, some disruptions in biliary tract development can also lead to pathologies affecting the extrahepatic biliary tract, resulting in choledochal cysts. Lastly, for reasons not yet entirely clear, we may encounter disruptions in both intrahepatic and extrahepatic biliary tracts, as seen in biliary atresia. The characteristic imaging findings of each pathology, in different imaging modalities, will be easier to identify and comprehend if we understand the embryological process and the development of the biliary tract.
Embriology:
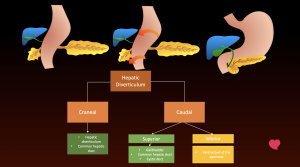
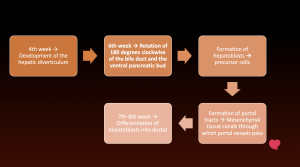
The hepatic diverticulum arises from ventral wall of primitive midgut. The pars hepatica originates from cranial part of hepatic diverticulum and develops into the liver primordium (blue) and the common hepatic duct (dark green). The caudal part of pars hepatica divides into superior bud (light green) and inferior bud (yellow). Gallbladder, cystic duct, and common bile duct originate from superior bud. The inferior bud develops into ventral bud of the pancreas. During sixth gestational week the ventral bud of the pancreas rotates 180° clockwise around the duodenum and come to lie in their definitive positions.
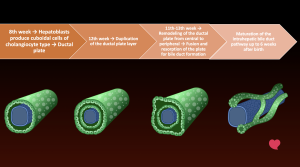
The developmental processes of the bile ducts can be better understood with a secuential approach and a diagram displaying ductal plate development.
Some abnormalities in this process can lead to anomalous development in different parts of the biliary tree, as shown in the classification of fibropolycystic liver disease. Different pathologies will develop according to the size of the ducts affected.
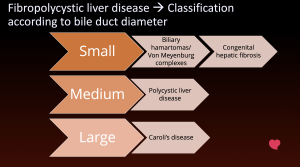
Fibropolycystic live diseases
Small bile ducts
- Biliary hamartomas
 Fig 5: Overview of biliary hamartomas.
-
Failure of apoptosis → Small non-communicating cysts
-
Multiple cysts < 10 mmComposition: cystic, solid, or mixed
-
Usually benign and asymptomaticComplications → Infections or malignant transformation (extremely rare)
- Imaging findings:
 Fig 6: On the left we can see an US longitudinal view of the the right hepatic lobe, where punctate echogenic images are seen creating a comet tail artifact (blue overlay). On the right, multiple diffuse lesions of low intensity on T1-weighted images and high intensity on T2-weighted images that do not communicate with the biliary tree.
US: Small cysts → Hyper, hypo, or mixed, Comet tail sign
CT: Small hypoattenuating lesions
MRI: T1 → Hypointense, T2 → Hyperintense
MRCP → No communication with bile ducts
-
- Congenital hepatic fibrosis
 Fig 7: Overview of congenital hepatic fibrosis.
-
Periportal fibrosis + ectatic communicating bile ducts
-
Presentation/Findings → Portal hypertension
-
Autosomal dominant polycystic kidney disease (ADPKD, other ductal malformations, Caroli syndrome
- Imaging findings:
 Fig 8: MR shows hypertrophy of the lateral segments and caudate lobe (red overlay), with normal-sized medial segments (green overlay) and atrophy of the right lobe (blue overlay). Findings associated with autosomal recessive polycystic kidney disease.
General: morphological changes, signs of portal hypertension, associated biliary abnormalities, renal parenchyma, regenerative nodules
US/MRI: Periportal fibrosis (Periportal hyperechoic thickening, T2 shoes increased periportal signal intensity
-
Medium bile ducts
- Polycystic liver disease
 Fig 9: Overview of polycystic liver disease.
-
Non-communicating periportal bile ducts
-
Associated with genetic diseases (family history + ≥ 20 cysts)
Autosomal dominant polycystic kidney disease (AD) → 50-66%
Autosomal dominant polycystic liver disease (AD)
-
Presentation/Findings:
Asymptomatic → greater growth in women.
Complications
Cysts → Hemorrhage, infection, torsion
Extrinsic compression → Vascular, bile ducts, extrahepatic structures.
-
Imaging findings
 Fig 10: Non-contrast CT shows abnormal renal and hepatic parenchyma due to multiple cystic lesions with diffuse distribution. On contrast enhanced CT, both kidneys have cysts with increase attenuation secondary to hemorrhagic content (red arrow)
General: Cystic lesions in all imaging modalities. Watchout for changes that could indicate complications.
-
Large bile ducts
- Caroli's disease
 Fig 11: Overview of Caroli's disease.
-
Described by Dr. Caroli in 1958
-
Saccular/fusiform dilation, diffuse or segmental, non-obstructive and communicating.
-
Clinical
80% → Develop symptoms before the 3rd decade
Recurrent cholangitis
Liver abscesses
Biliary lithiasis
Cholangiocarcinoma → biliary obstruction
-
Caroli syndrome (more common) =
Congenital hepatic fibrosis + Caroli disease
- Imaging findings
 Fig 12: Contrast enhanced CT (left) shows non-enhancing cystic lesions in the right hepatic lobe. MRCP (middle and right) showing saccular dilation of the intrahepatic bile ducts, findings related to Caroli disease. Differential diagnosis include: sclerosing cholangitis → Isolated fusiform dilations, Recurrent pyogenic cholangitis → Dilation of intra- and extrahepatic bile ducts, and polycystic disease
General: 'Central dot' sign
→ Cystic space surrounded by a portal branchSaccular dilations of the intrahepatic bile ducts. Fig 13: MR shows typical central dot sign on T2-weighted imaging, the bile ducts appear hyperintense due to fluid (green overlay), while the central dot (portal vein) is hypointense (blue overlay).
Magnetic resonance cholangiopancreatography (MRCP): Hepato-specific contrast in certain cases to demonstrate communication.
-
Pancreatobiliary junction
- Pancreatobiliary junction outside of the duodenal wall (>10 mm)
- Sphincter of Oddi unable to regulate the junction which promotes reflux which has been proven to be carcinogenic
- Classification: SPBM 2015
- Diagnosis: US, MRCP
- Imaging findings Fig 15: MRCP showing abnormal dilated left intrahepatic bile ducts (right). Coronal maximum intensity projection (MIP) images from three-dimensional (3D) MRCP showing an abnormal pancreaticobiliary junction with a long common channel, noting an abrupt change in caliber (pancreatic duct not shown).
- Evaluation of the anatomy of the biliary tree.
Choledocal cyst 
- 4:1 Female to male ratio
- Triad: abdominal pain, mass in the right hypochondrium, and jaundice
- 20% diagnosed in adults
- Todani classification Fig 16: Overview of choledocal cysts.
- Type I
 Fig 17: Ultrasound shows dilation of the intrahepatic and extrahepatic bile ducts, with an abrupt change in the caliber of the common bile duct without evidence of a clear obstructive cause. Distended gallbladder with stones inside, without ultrasound signs of cholecystitis.
 - Type II
 Fig 19: MR shows cystic dilation of the distal bile duct in the pancreatic segment of the common bile duct, corresponding to a type II choledochal cyst, associated with a small punctate hypointense signal in its posterior wall, which could correspond to biliary sludge or a small stone (red arrow).
 - Type IVa
 Fig 20: Ultrasound shows long axis of the liver with the presence of a dilated cystic structure in the hepatic hilum with no flow in color Doppler evaluation, which appears to be continuous with the biliary ducts and generates slight mass effect on vascular structures of the hepatic hilum. These findings were associated with dilation of central intrahepatic bile ducts.
- Type I
Biliary atresia
- Fetal/Infantile Inflammatory cholangiopathy → Progressive fibrosis and destruction of intrahepatic and extrahepatic bile ducts
- Most common cause of neonatal cholestasis (1/10,000)
- Biliary atresia (20-45%) vs. genetic causes (25%)
- Most common indication for liver transplantation in pediatrics
- Clinical Presentation :Jaundice, acholic stools, dark urine
- Conjugated hyperbilirubinemia, elevated GGT
- Types:
- Non-syndromic (80-90%) vs. Syndromic (heterotaxy, polysplenia, congenital heart disease, IVC anomalies)
- Cystic subtype
- Differential diagnoses
- Choledochal cyst: Cystic subtype of atresia
- Neonatal hepatitis
- Bile plug syndrome
- Cholestasis: Cystic fibrosis, Alpha-1 antitrypsin deficiency, Alagille syndrome
- Imaging findings on ultrasound
- "Ghost gallbladder"
 Fig 24: Imaging findings of biliary atresia on US.
 - Increased diameter of hepatic artery. Fig 24: Imaging findings of biliary atresia on US.
- Increased subcapsular flow
 Fig 25: Imaging findings of biliary atresia on US.
 - "Triangular cord sign"Fig 25: Imaging findings of biliary atresia on US.
- "Ghost gallbladder"
- Cystic subtype
 Fig 26: Contrast-enhanced CT shows multiple saccular dilations of the central intrahepatic bile ducts with no clear visualization of the gallbladder or extrahepatic bile ducts, findings suggest biliary atresia - cystic subtype.
 - Syndromic type
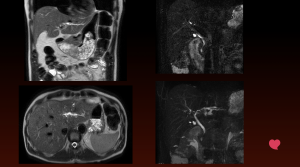
 Fig 27: Contrast enhanced MR showing cystic images and segmental dilatations of both intrahepatic and extrahepatic bile ducts (green arrow), signs of left heterotaxy with interruption of the retrohepatic segment of the inferior vena cava and continuation with the azygos vein (blue circle) and polysplenia (orange arrow); these findings suggest biliary atresia - syndromic type.