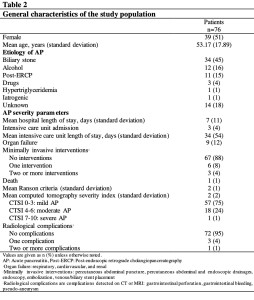
Patients
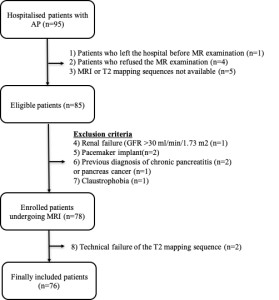
A total of 95 consecutive patients diagnosed with AP were admitted to the Visceral surgery Department of CHUV between December 2020 and November 2022. The process of patient inclusion is shown in Figure 4.
Inter-observer reproducibility
The ICC was good between the two readers for the overall analysis (0.85, 95% confidence interval (CI) = 0.77–0.90), as well as for each anatomical location (0.80, 95% CI = 0.75–0.84).
T2 values across the three anatomical locations and CT LocIn Score
We found no significant difference in T2 values across the anatomical locations. The mean T2 values were 76 ± 18, 76 ±18, and 76 ± 18 msec in the head, body, and tail of the pancreas, respectively.
However, T2 values in the same patient for the three different anatomical regions of the pancreas correlated positively with the presence of inflammation using the specially developed CT LocIn Score (head: Rs(76) = 0.74, P < 0.001; body: Rs(76) = 0.66: P < 0.001; tail: Rs(76) = 0.52: P < 0.001; all three anatomical regions together: Rs(228) = 0.64, P < 0.001).
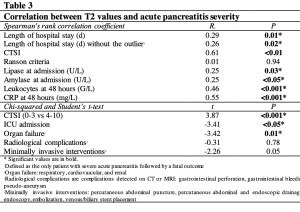
T2 values and correlation with patient characteristics and AP severity
No significant correlation was found between the T2 values and patient age (Rs(76) = 0.18; P = 0.13), sex (male: 77 ± 18 msec, female: 75 ± 14 msec; t(65) = -0.44; P = 0.66), BMI (Rs(75) = 0.06; P = 0.61) or main pancreatic duct dilatation (presence of dilatation: 86 ± 21 msec, absence of dilatation: 75 ± 15 msec; t(9) = -1.54; P = 0.16).
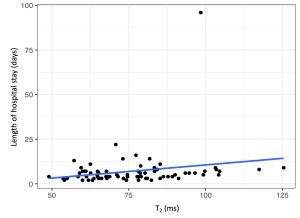
Spearman correlation revealed a significant positive association between T2 values and the length of hospital stay (Rs (76) = 0.29, P = 0.01).
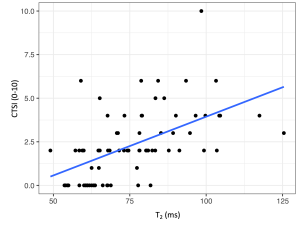
For the exploratory outcomes, T2 values correlated significantly with the CTSI (Rs (73) = 0.61, P < 0.001; CTSI 0-3: 72 ±14 msec, CTSI 4-10: 88 ± 15; t(29.05) = -3.87; P < 0.001),
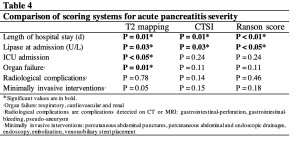
Comparisons between T2 mapping, CTSI, and the Ranson score are shown in Table 12.