Case 1
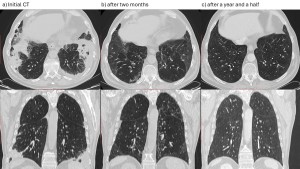
A man in his early fifties, heavy smoker. Lung CT Analyzer highlights severe emphysema affecting both lungs, with a larger volume in the right lung. Additionally, infiltrates and collapsed areas contribute to further functional impairment, suggesting chronic inflammation or fibrosis. These findings are consistent with advanced COPD, as confirmed by spirometry.


Educational points:
- CIP can be employed in studies which need quantification of emphysema, air trapping, airway abnormality and vascular pruning in COPD patients.
- In COPD, the Parenchyma Analysis module reveals a high percentage of voxels below the -950 HU threshold (LAA%-950), consistent with emphysematous changes.
- However, quantitative volumetric assessment has limitations, as image noise can affect the measurements. As demonstrated by Lynch D et al., quantitative CT evaluation should be considered a complementary tool to the visual Fleischner Society scoring system for emphysema. Moreover, the severity of emphysema assessed through visual evaluation is associated with significantly increased mortality risk, independent of the quantitative severity of emphysema.
Case 2
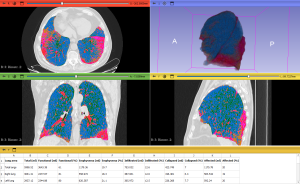
An elderly patient with a diagnosis of UIP (Usual interstitial pneumonia). Lung CT analyzer reveals infiltrative and collapsed changes in both lungs, with slightly more involvement on the right lung. The Parenchyma Analysis module shows a high percentage of voxels within the -600 HU to -250 HU range (HAA%-600-250), indicative of UIP-related interstitial changes.


Educational points:
- A study by Ash S et al. demonstrated that UIP is typically characterized by higher HAA%-600-250, higher MLD (mean lung density), and lower skewness and kurtosis. These values are due to UIP-related interstitial changes, such as honeycombing, ground glass and reticular opacities. Notably, the study reported an average HAA%-600-250 of 17.21%, with an interquartile range of 12.54%-23.13%.
- These values are often associated with a shorter transplant-free survival.
- Densitometric measures were also correlated with forced vital capacity and diffusing capacity
Case 3
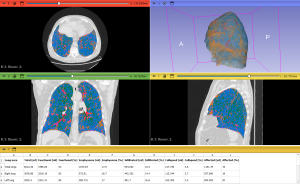
A patient in her early sixties with COVID-19 pneumonia affecting 47% of lung tissue due to infiltration and collapse, requiring ICU admission for intensive care.

Educational points:
- The utility of the Lung CT Analyzer module during the COVID-19 pandemic was explored in a study by Bumm R et al. This study demonstrated that patients with >40% lung involvement (infiltrated + collapsed areas) segmented using this tool were predominantly treated in the ICU, effectively predicting the need for intensive care.
- While a strong correlation between expert and computer analyses was observed, Bumm R et al. consider this approach promising but emphasize the need for further research to refine and optimize 3D Slicer computer analysis tool and to validate its utility across diverse clinical settings. Additionally, patterns such as ground-glass opacities (GGO) may not yet be accurately detected by threshold-based algorithms, and factors such as the presence of artifacts and variability in CT scan quality can impact the accuracy of automated segmentation.
- Nonetheless, this study has several limitations, including small sample sizes and retrospective study designs. Further research is warranted to address these challenges and validate these findings.
Case 4
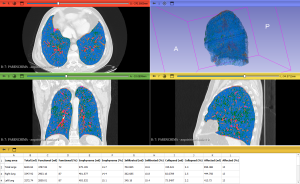
An elderly patient with stage IV non-small cell lung cancer (NSCLC) undergoing pembrolizumab treatment developed immunotherapy-induced pneumonitis.
Following two months of prednisone therapy, CT shows a significant reduction in the density of consolidations, which are nearly completely transitioned into GGO. Clinically, the patient exhibits substantial improvement.
However, quantitative analysis indicates an apparent increase in infiltrates accompanied by a reduction in collapsed areas.
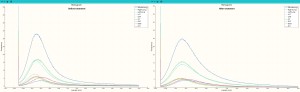
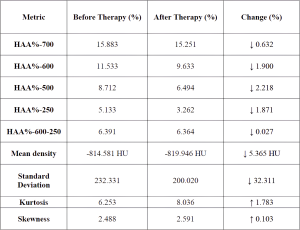
This apparent discrepancy can be attributed to the persistence of some infiltrates and a pattern reminiscent of the "tinted sign" or "melted sugar sign", usually observed in COVID-19 pneumonia. This sign is characterized by an increase in the extent of GGO or consolidations alongside a simultaneous reduction in their density. As a result, infiltrates may appear quantitatively larger, despite a clear decrease in consolidation density. This phenomenon likely reflects the gradual regression of inflammatory infiltrates, edema, or hemorrhaging, along with the re-expansion of alveoli. The histogram analysis supports these findings, showing a rightward shift and a broader curve after therapy, consistent with the persistence of higher-density areas.
However, the Parenchyma Analysis module confirms post-therapy improvement, revealing reductions in HAA% and MLD, both indicative of decreased density of consolidations.
Educational points
- This case highlights a limitation of quantitative analysis using the Lung CT Analyzer compared to visual assessment, particularly due to the rigid thresholds employed for defining infiltrates. In the presence of the "tinted sign" or "melted sugar sign", quantitative analysis may indicate an increase in infiltration volume, even when there is a clinical and visual radiological improvement.
- Integrating visual interpretation with quantitative data is crucial, as quantitative results may not always accurately reflect clinical progress.
- The Parenchyma Analysis module offers valuable insights in such cases, providing detailed density metrics and histogram representations that facilitate a better understanding of the underlying changes in lung parenchyma.
- As this is a single case, these observations require further validation through studies involving a larger number of cases to ensure their reliability and broader applicability.