Congress:
ECR25
Poster Number:
C-10714
Type:
Poster: EPOS Radiologist (scientific)
Authorblock:
R. Agarwal, R. Thakka, S. Chikatla, A. Kalegowda; Bengaluru/IN
Disclosures:
Ritika Agarwal:
Nothing to disclose
Rajeshwari Thakka:
Nothing to disclose
Sowmya Chikatla:
Nothing to disclose
Anand Kalegowda:
Nothing to disclose
Keywords:
CNS, Emergency, Neuroradiology brain, CT, CT-High Resolution, CT-Quantitative, Computer Applications-Detection, diagnosis, Haemorrhage, Hypertension
-
Patient Demographics:
- 150 patients; mean age 61.17 ± 15.36 years; 56% male.
- Smoking (24%), alcohol use (20%), diabetes (42%), and hypertension (57.3%) were common.
-
Hematoma Expansion (RHE):
- RHE occurred in 74 patients (49.3%).
- RHE group had higher prevalence of smoking (54.1% vs. 21.1%), alcohol use (50% vs. 13.2%), diabetes (59.4% vs. 25%), and hypertension (70.2% vs. 44.7%).
- The median GCS score was lower in RHE group compared to non- RHE group.
- Baseline ICH volume was larger in RHE group (18.92 ± 18.14 mL vs. 13.65 ± 15.32 mL, p = 0.041).
-
NCCT Marker Findings:
- Hypodensity: Most frequent marker (57.3% cases), strongest predictor of RHE (OR: 6.214, p < 0.001).
- Sensitivity: 78.4%, Negative Predictive Value: 75%.
- Irregular Shape: Present in 41.3% cases, significant predictor of RHE (OR: 3.254, p = 0.001).
- Swirl Sign: Present in 11.3% cases, significant predictor of RHE (OR: 2.33, p < 0.001).
- Highest specificity (100%) and Positive Predictive Value (100%).
- Other markers (e.g., black hole sign, blend sign, fluid level) showed lower predictive value.
- Hypodensity: Most frequent marker (57.3% cases), strongest predictor of RHE (OR: 6.214, p < 0.001).
-
Subgroup Analysis:
- Gangliocapsular Bleeds:
- Hypodensity (OR: 4.978, sensitivity: 75.7%, specificity: 61.5%).
- Swirl sign (OR: 2.696, p < 0.001).
- Peripheral Lobar Bleeds:
- Hypodensity (OR: 7.912, sensitivity: 81.1%, specificity: 64.9%).
- Fluid level (OR: 6.481, p = 0.012).
- Irregular shape (OR: 5.587, p = 0.001).
- Gangliocapsular Bleeds:
-
Multivariate Analysis:
- Hypodensity (p < 0.001) and irregular shape (p = 0.049) were independent predictors of RHE with hypodensity demostrating the highest predictive accuracy.

Table 1: Demographic, clinical, and imaging characteristics of study population, comparing those with and without RHE.
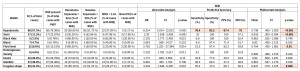
Table 2: Association between radiological signs and hematoma expansion (RHE), including their predictive accuracy for clinical outcomes, univariate and multivariate analysis.
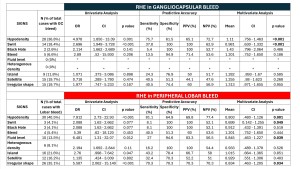
Table 3: Association between radiological signs and hematoma expansion (RHE) for different regions, including their predictive accuracy for clinical outcomes, univariate and multivariate analysis.