Back to the list
Congress: ECR25
Poster Number: C-20882
Type: Poster: EPOS Radiologist (scientific)
Authorblock: A. Van Der Most1, C. Balta2, K. Bishop2, J. Heemskerk1, A. J. Van Der Molen1, I. I. A. Dekkers1; 1Leiden/NL, 2Amstelveen/NL
Disclosures:
Arjen Van Der Most: Nothing to disclose
Christiana Balta: Employee: Canon Medical Systems Europe
Kelly Bishop: Employee: Canon Medical Systems Europe
Jan Heemskerk: Nothing to disclose
Aart J. Van Der Molen: Nothing to disclose
Ilona I. A. Dekkers: Grant Recipient: Canon Medical Systems Europe
Keywords: Radioprotection / Radiation dose, CT, CT-High Resolution, Image manipulation / Reconstruction, Equipment, Physics, Quality assurance
Results

Images were acquired at dose levels representing low-dose Ca score, low-dose CTA, CTA standard, standard abdomen and high-resolution thorax protocols, and images have been reconstructed for AiCE levels 1, 2, 3 (Mild, Standard, Strong) and PIQE levels 1, 2, 3 (Mild, Standard, Strong).

Differences in Hounsfield Units (HUs) between AiCE and PIQE were 4 HUs or less for all inserts and scan and reconstruction settings.

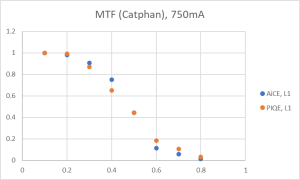
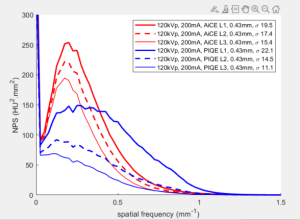
For all dose levels the SR-DLR (i.e. PIQE) simultaneously improves MTF resolution (see figs. 2 and 4) and noise (see figs. 8-10). 

Fig 2: MTF plot per dose level

Fig 3: MTF plot PIQE for different dose levels.

Fig 4: MTF plot for AiCE and PIQE at highest dose level.

This combined effect is even more noticeable visually (as opposed to measured), see figs. 5-7.

Fig 5: MTF inserts reconstructed with different PIQE settings, at 200mA. Clockwise from top right: 4, 5, .. to 9 linepairs/cm. Note that though the quantified plot (fig. 2 right center, above) does not show much difference between PIQE Mild and PIQE Strong, visual evaluation shows superior discrimination for the 7-9 linepairs insert for PIQE Mild

Fig 6: MTF (linepairs/cm) slice for AiCE Mild at 60, 200, 400, 750 mA. Clockwise from top right: 4, 5, .. to 9 linepairs/cm.

Fig 7: MTF (linepairs/cm) slice for PIQE Mild at 60, 200, 400, 750 mA. Clockwise from top right: 4, 5, .. to 9 linepairs/cm. Note that the 200 mA image (2nd from the left) is the only image in which the 9 linepairs/cm inserts can be weakly distinguished, but also that at 200 mA (for both AiCE and PIQE) some small streaks can be seen near the 4 and 5 linepairs/cm inserts.

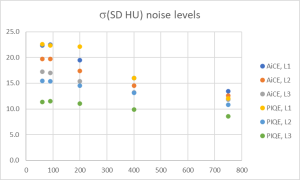
Noticably, PIQE results in lower noise levels (expressed as standard deviation), even though the pixels are twice as small (0.22 mm vs 0.43 mm for PIQE and AiCE, resp.). 

For all dose levels, for both AiCE and PIQE, the Mild setting results in the highest noise level, and Strong in the lowest noise level (see fig. 8), even though resolution (MTF) is hardly affected by increasing the strength of the AI-reconstruction (see figs. 2 and 5).

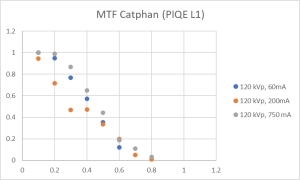
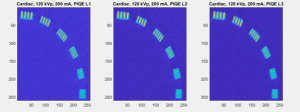
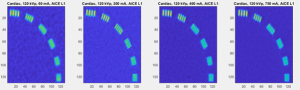
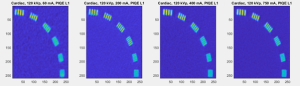
Judging from the MTF-values (fig. 2 and 3) overall MTF seems well maintained for all dose levels and all reconstructions. However, looking at the actual images (figs. 5-7), it can be seen that the 7, 8 linepairs/cm can no longer be distinguished at lower dose levels. The 200 mA images have the highest resolution, possibly because this is the highest mA with small focal spot, but these are also the only images in which streaking artefacts can be seen (figs. 6 and 7).

Fig 8: 3D noise power spectra for 200 mA scan for different AiCE and PIQE levels. For both AiCE and PIQE noise decreases with increasing strength (i.e. from L1 to L3), but high-frequency information is also suppressed.

Fig 9: 3D Noise Power spectra for AiCE Mild (left) and PIQE Mild (right) for different dose levels. Note the different scale for y-axis.

Fig 10: Noise (standard deviation of a uniform area of 200 × 200 pixels (AiCE) or 400 × 400 pixels (PIQE), averaged over 80 slices).

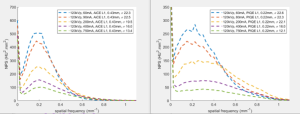
Furthermore, noise (standard deviation) of the super-resolution reconstructions suffers less from decreasing dose levels (fig. 10), while MTF is relatively well maintained, which is very promising with regard to optimization of dose levels.

GALLERY