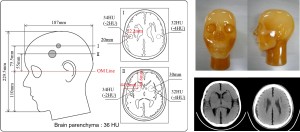
1. Development of phantom to cerebral infarction
Using a cerebral infarction phantom, which had been developed by the authors (Kyoto kagaku, JPN), an imitation disease with 34 HU was set to be visualized. The phantom, prepared with polyurethane resin and epoxy resin, the developed phantom mimicked the head shape and was composed of three sections: brain, cranium, and imitation disease. In the brain section, sphere-shaped imitation diseases (acute-stage cerebral infarction) of 30 mm in diameter were allocated in the middle cerebral artery region. The CT value of the brain section was 36 HU and that of the cranium was 900 HU (Fig.2).
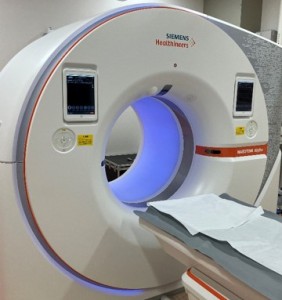
2. Imaging conditions and Reconstruction
Photon-counting detector CT (NEOTOM Alpha in SIEMENS Healthineers, DE; Fig.3) images were created using virtual monoenergetic reconstructions imaging (VMI) in 60 to 70 keV at 1 keV intervals for 11 images, under conditions of 120 and 140 kV, 500 and 800 mA, rotation speed 0.5 s, slice thickness 5.0 mm.
3. Imaging evaluation
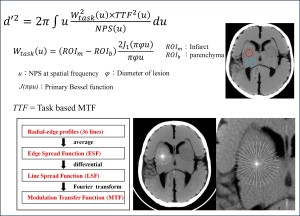
3-1. detectability index (d'2)
Detectability index (d'2) is an index that enables evaluation including the effect of low-frequency noise, which is a problem in virtual monoenergetic reconstructions X-ray CT images, and provides results more consistent with visual impression [9]. Wtask is an index that includes lesion size, shape, and contrast difference, and TTF is an index that takes into account the size and shape of the lesion, referring to the MTF obtained by the radial edge method (Fig.4).
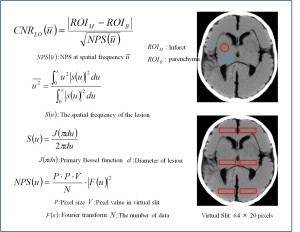
3-2. Low contrast object specific CNR (CNRLO)
The CNRLO value at the 30-mm-diameter imitation disease section in each VMI image was ability to visualize acute-stage cerebral infarctions were evaluated [10]. In the formula, ROIM represents CT value and ROIB represents SD value, and circular ROI size of 170 mm2. The Noise power spectrum (NPS) value of the normal brain parenchyma six section in virtual slit (60 * 24 pixels). Still more, u represents the spatial frequency (0.17 cycle / mm) contributing to the detection of diameter of diseased part 30 mm (Fig.5).
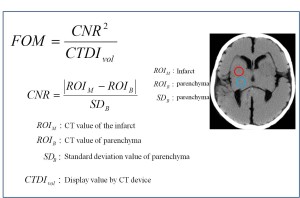
3-3. Figure of Merit (FOM)
Figure of Merit (FOM) is an indicator to evaluate the degree of image quality improvement per patient's exposure dose. The higher FOM indicates more efficient shooting conditions [11]. FOM was calculated from the formula of CNR2 / CTDIvol. CTDIvol indicates the absorbed dose value displayed by the calculation of the X-ray CT apparatus (Fig.6).