Among the 85 pediatric patients enrolled, 74 (87.1%) were diagnosed with viral infections, while 11 (12.9%) had bacterial pneumonia. LUS findings demonstrated a clear distinction between bacterial and viral pneumonia cases.
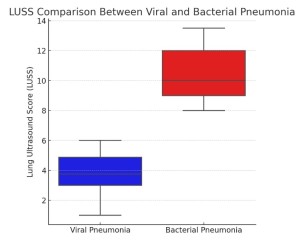
Patients with bacterial pneumonia exhibited significantly higher LUSS (median = 10, range 8–13.5) compared to those with viral infections (median = 3, range 1–6) (p < 0.0001).
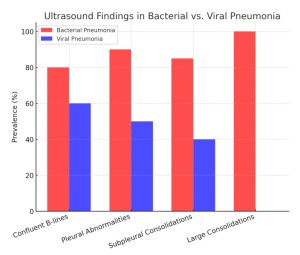
Specific LUS abnormalities, including confluent B-lines, pleural irregularities, and subpleural consolidations, were observed more frequently in bacterial pneumonia cases. Notably, large consolidations (> 1 cm) were detected exclusively in bacterial pneumonia cases. Conversely, viral pneumonia was characterized by more diffuse B-lines, indicative of interstitial involvement, and the absence of large consolidations.
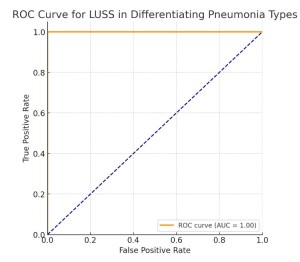
ROC curve analysis revealed that the presence of large consolidations had a sensitivity and specificity of 100% for bacterial pneumonia diagnosis.
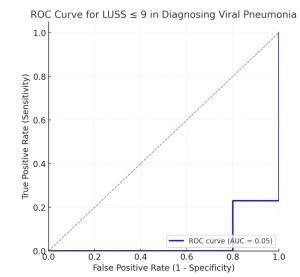
Additionally, a LUSS threshold of 9 or less was associated with 77.14% sensitivity and 80% specificity for viral pneumonia, further highlighting the diagnostic potential of LUS in differentiating between the two etiologies.
These findings suggest that LUS provides valuable diagnostic information that can aid clinicians in determining the etiology of pediatric pneumonia, potentially reducing reliance on ionizing imaging techniques and unnecessary antibiotic prescriptions.