Findings and procedure details
IMAGING FINDINGS - BRAIN
Acute Imaging Findings
Venous Sinus Engorgement
Seen in 75–93% of cases, CSF volume loss leads to compensatory venous expansion, producing bulging, convex transverse, and sigmoid sinus margins (normally flat or concave), best assessed at the mid-portion of the dominant transverse sinus, this is often the earliest imaging finding and the first to normalize after treatment(7).
Fig 3: A 50-year-old with chronic orthostatic headaches and mild cognitive slowing.
Figures A and B: Coronal and Sagittal T2-weighted image shows prominent bilateral transverse sinuses with convex margins (white arrows) and bilateral subdural collections (red arrows).
Figure C: MR venogram confirms engorgement of the dural venous sinuses.
Subdural Collections
Present in 50–54% of patients. Results from transudation of fluid or rupture of small vessels due to brain sag. Collections range from thin hygromas to large hematomas. They are almost always bilateral, favoring the frontoparietal convexities with rare posterior fossa involvement.
Differential:Trauma (8).
Pachymeningeal Thickening and Enhancement
Occurs in ~83% of cases. Shows smooth, diffuse, non-nodular dural thickening over the cerebral convexities and posterior fossa, sometimes extending into the spine. It reflects fibrocollagenous dural proliferation from persistent venous engorgement and transudation of fluid into the subdural space. Dural thickening of the internal auditory canal is a highly specific imaging sign.
Differentials:Neoplastic/inflammatory disease, typically focal/nodular/irregular (8).
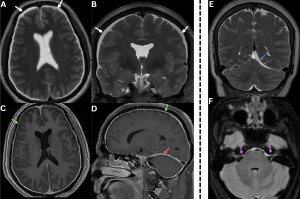
Fig 4: Figures A and B: Axial and coronal T2-weighted MR images demonstrating bilateral subdural hygromas (white arrows), seen as CSF-intensity fluid collections along the frontoparietal convexities.
Figures C and D: Axial and sagittal post-contrast T1-weighted images demonstrate diffuse smooth dural (green arrows) and tentorial (red arrow) enhancement over the bilateral cerebral hemispheres, consistent with pachymeningeal enhancement......Case 2—A patient with a chronic history of orthostatic headache, associated with neck stiffness and auditory symptoms, was evaluated for suspected spontaneous intracranial hypotension.
Figure E: Coronal T2-weighted MR image demonstrates a subdural collection along the left tentorium(blue arrow). {To our knowledge, tentorial subdural collection in spontaneous intracranial hypotension has not been previously described in the literature.}
Figure F: Axial T2/FLAIR MR image demonstrates dural thickening and hyperintensity along the brainstem and bilateral internal auditory canals(purple arrows).
Pituitary Engorgement
Seen in ~38% of cases due to pituitary hyperemia, producing enlargement with a convex superior margin.
Mimics:Pituitary-adenoma, hypophysitis, pituitary-hyperplasia (9).
Reduced Perioptic CSF
Lowered CSF pressure results in narrowing of the optic nerve sheath subarachnoid space, with partial/complete loss of the normal perioptic fluid signal, indicating reduced perioptic CSF-volume. (10).
Fig 5: Figure A: Sagittal T1-weighted MRI demonstrates an enlarged pituitary gland (red arrow). Sagging of the brain is also evident, with inferior displacement of the brainstem and cerebellar tonsils (white arrow).
Figure B: Coronal T2-weighted MRI shows an enlarged pituitary gland (red arrow) extending into the suprasellar cistern and indenting the optic chiasm (green arrow).
Figures C and D. Axial and coronal T2-weighted MR images demonstrating collapsed bilateral optic nerve subarachnoid spaces (yellow arrows) secondary to low CSF pressure
Brain Sagging
Loss of brain buoyancy from reduced CSF volume leads to descent of intracranial structures. Qualitatively, this appears as downward displacement of the brainstem and cerebellar tonsils, effacement of the prepontine/perimesencephalic cisterns, flattening of pons, and crowded posterior fossa.
Fig 6: A 42-year-old presenting with a recent onset of orthostatic headaches and dizziness.
Figure A: Sagittal T1-weighted image of the brain shows flattening of the ventral surface of the pons (blue arrow), sagging of the brainstem (white arrow), and descent of the cerebellar tonsils (red arrow) beyond the McRae line (white dotted arrow).
Figure B: Axial T2 FLAIR image demonstrates increased anteroposterior diameter of the midbrain (yellow arrow) with effacement of the perimesencephalic cisterns (purple arrow).
Figure C: Coronal T2-weighted image showing herniation of bilateral cerebellar tonsils into the foramen magnum (green arrow).
Quantitative signs (9).
- Reduced pontomesencephalic angle (<50°)
- Decreased mammillopontine distance (<6.5 mm)
- Narrowed interpeduncular angle (<40.5°)
- Inferior displacement of the cerebral aqueduct (iter) below the incisural line
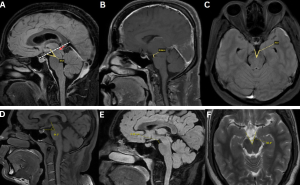
Fig 7: Figure A: Measurement of the pontomesencephalic angle, defined as the angle between a line along the anterior margin of the midbrain and a line along the anterosuperior margin of the pons. A reduced angle (<50°) is indicative of downward brain displacement. An incisural line (drawn from the tuberculum sellae to the straight sinus confluence) demonstrates inferior displacement of the cerebral aqueduct/iter (red arrow) below this line (white dotted line).
Figure B: Measurement of the mamillopontine distance, defined as the shortest distance between the mamillary bodies and the superior aspect of the pons. A value <6.5 mm supports the presence of brain sagging.
Figure C: Measurement of the interpeduncular angle, formed by the posterior halves of the cerebral peduncles. A reduced angle (<40.5°) is associated with spontaneous intracranial hypotension.
Figures D–F. Normal reference measurements for comparison.
Figure D: Normal pontomesencephalic angle
Figure E. Normal mamillopontine distance
Figure F: Normal interpeduncular angle
Differential:Chiari-I-malformation.
Fig 8: The figure demonstrates a case of Arnold–Chiari malformation with an accompanying table summarizing the key imaging features that differentiate Arnold–Chiari malformation from spontaneous intracranial hypotension.
Cerebral Venous Sinus Thrombosis (CVT)
A rare complication (~2%). CSF depletion causes venous dilation and sluggish flow, predisposing to thrombosis. Contributing factors include CSF diverting into the epidural space (increasing venous viscosity) and downward brain sag exerting traction on parenchymal veins, further slowing venous return (11).
Fig 9: Clinical History: A 33-year-old woman with a several-week history of orthostatic headache, initially postural, with recent worsening associated with nausea and blurred vision.
Figure A. Axial post-contrast T1-weighted image demonstrating bilateral fronto-parietal subdural collections (red arrows), smooth pachymeningeal enhancement (green arrows) with thrombosis of the superior sagittal sinus (white arrow).
Figure B. MR venogram MIP image showing extensive venous sinus thrombosis involving the superior sagittal, inferior sagittal, straight, transverse, and sigmoid sinuses.
Figure C: Axial SWI reveals numerous prominent venous channels within the brain parenchyma, consistent with sequelae of chronic dural venous sinus thrombosis (blue arrow).
Bern’s scoring system
MRI-scoring system that predicts the probability of a CSF leak (9)
Table 10: Summary of MRI features included in the Bern Score, with assigned point values and thresholds. The total score aids in stratifying the probability of an underlying spinal CSF leak in patients with suspected spontaneous intracranial hypotension.
Chronic Imaging Findings
Occurs in ~14% of chronic cases as a compensatory response to longstanding CSF depletion. New bone formation along the inner table, most prominently in the frontal region, produces a “layer cake” appearance (12).
Typically involves the superior cerebellar folia in the posterior fossa and results from repeated bleeding of fragile epidural veins, leading to hemosiderin deposition. Nearly 50% of cases are associated with a spinal extradural CSF collection, supporting an underlying CSF-leak (9).
Fig 11: Figure A: Bone-window CT of the skull shows calvarial cortical thickening (red arrow), consistent with osseous changes associated with chronic low cerebrospinal fluid pressure.
Figure B: Axial SWI images show hypointense curvilinear susceptibility artifacts along the cerebellar folia and the brainstem surface, consistent with hemosiderin deposition (green arrow), suggestive of superficial siderosis.
IMAGING FINDINGS - SPINE
Acute imaging findings
Spinal epidural CSF collections in SIH may be ventral/dorsal/circumferential. Their presence helps categorize SIH based on SLEC status:
- SLEC-Positive SIH: Seen in Type 1 and Type 2A leaks.
- SLEC-Negative SIH: Seen in Type 2B and Type 3 leaks (10).
Fig 12: Clinical History: A 29-year-old man presenting with a sudden-onset postural headache.
Figures A and B. Sagittal and axial T2-weighted MR images demonstrating a long-segment T2 hyperintense anterior spinal epidural fluid collection (green arrows).
Types of Spinal CSF Leaks
Type 1 – Ventral Dural Tear
Caused by a ventral dural defect, usually associated with a discogenic spur or osteophyte. Results in a ventral epidural collection (SLEC-positive) (4).
Fig 13: Figure A: Illustration demonstrating a spinal ventral dural tear caused by a calcified discal spur (straight black arrow). Black curved arrows indicate the route of cerebrospinal fluid (CSF) leakage into the epidural space.
Figure B: Sagittal bone-window CT image of the thoracic spine showing a discogenic spur (red arrow).
Figure C: Sagittal T2-weighted MR image of the thoracic spine demonstrating a T2 hyperintense anterior spinal epidural collection (SLEC) (green arrow).
Type 2 – Meningeal Diverticulum/Nerve Root Sleeve Leak
Subdivided based on SLEC status:
- Type 2A (SLEC-Positive): Proximal nerve root sleeve tears, ruptured meningeal diverticula, or an absent nerve root sleeve leading to a CSF collection in the epidural-neural foraminal compartment.
Fig 14: Figure A: Illustration showing thick black arrows pointing to a diverticulum with a tear, while the short black arrow indicates the route of the CSF leak.
Figure B: CT myelogram shows lateral epidural collection (green arrows).
Figure C: Coronal STIR image shows multiple meningeal diverticulae, the largest on the left (red arrow), which is presumed to be causing the leak.
- Type 2B (SLEC-Negative): Distal or far-lateral nerve root sleeve tears causing CSF leakage into adjacent fascia or soft tissues without forming an epidural collection (10).
Fig 15: Figure A: Illustration depicting a distal nerve root sleeve tear, with the curved arrow indicating the direction of cerebrospinal fluid (CSF) leak.
Figures B and C: Coronal STIR and axial T2 weighted images show multiple diverticulae in the thoracic spine (green arrows). A linear track of T2 hyperintensity is seen extending superiorly from one of them on the left, suggesting a CSF leak (red arrow). No epidural collection is seen on the axial T2 image.
Type 3 – CSF–Venous Fistula
CSF drains directly into venous channels, so no epidural collection (SLEC-negative) is seen. CVFs are most common in the lower thoracic spine and in older patients, often occurring adjacent to perineural cysts and paraspinal veins without a visible dural defect (9,13).
Fig 16: Figure A: Illustration with a thick black arrow indicating the site of the CSF–venous fistula.
Figures B and C: Coronal and axial lateral decubitus CT myelogram shows a diverticulum (blue arrow) with a CSF venous fistula draining into the lateral branches of the external vertebral venous plexus (white arrows).
Type 4 – No identifiable cause
Leaks may also be classified by flow rate: fast-leaks, typically due to a ventral dural tear, and slow-leaks, usually related to nerve-root sleeve defects or a CSF–venous fistula (10).
- Spinal Pachymeningeal Enhancement
Smooth, linear dural enhancement may be seen along any level of the spinal canal.
Fig 17: Clinical History: A 42-year-old man with a chronic orthostatic headache.
Figures A and B. Sagittal pre-contrast and post-contrast T1-weighted images demonstrating smooth, linear pachymeningeal enhancement along the lower thoracic dura and conus medullaris (blue arrows).
- Engorged Epidural Venous Plexus
Reduced CSF pressure leads to compensatory dilation of the epidural venous plexus, most prominently in the cervical spine (14).
Fig 18: Figures A and B: Sagittal and axial post-contrast T1-weighted MR images demonstrate engorged spinal venous plexus (green arrows).
Chronic Spinal Findings
- Chronic Longitudinal Epidural Collection
Long-standing epidural CSF collections may become loculated, with smooth, rounded margins and thin internal septations, giving a pseudomeningocele-like appearance (10).
Fig 19: A 42-year-old with long-standing postural headaches and neck stiffness.
Figure A: Sagittal T2-weighted MRI showing anterior epidural collection (red arrow).
Figure B: Axial T2-weighted MRI demonstrating anterior epidural collection with smooth, rounded margins (green arrow), consistent with chronic spinal longitudinal extradural collection (SLEC).
In chronic SLEC-positive cases, persistent ventral epidural collections may compress the anterior horn cells and stretch the cervical nerve roots, resulting in progressive cord and root atrophy and clinically manifesting as bibrachial amyotrophy (15).
Fig 20: A 52-year-old man with a 6-month history of chronic orthostatic headache and progressive mid-thoracic discomfort, previously untreated for SIH.
Figure A: Axial T2-weighted image of the thoracic spine showing T2 hyperintensities in the region of anterior horn cells (red arrow) along with a T2 hyperintense anterior epidural fluid collection (green arrow).
MYELOGRAPHIC TECHNIQUES
Ultrafast CT Myelography (CTM)
Performed in the prone Trendelenburg position after intrathecal contrast injection, with rapid serial acquisitions to track contrast as it travels along the thecal sac. This technique is especially useful for fast leaks (SLEC-positive), where early extravasation helps pinpoint the leak site.
Fig 21: Figures A–D. Prone-decubitus myelography technique and imaging findings.
Figure A. Patient positioned prone in slight decubitus to allow dependent contrast layering
Figure B. Lumbar puncture performed with iodinated contrast injected into the thecal sac (blue arrow).
Figure C. CT image demonstrating contrast layering within the thecal sac (red arrow).
Figure D. CT myelogram showing contrast splitting with efflux into the epidural space through a dural defect, consistent with a spinal CSF leak.
Flow void sign
Seen as linear or focal areas of intradural signal loss on T2-weighted images, caused by rapid CSF flow escaping from the subarachnoid-space into the epidural space. This sign serves as a useful marker for localizing the dural defect in ventral Type 1 CSF leaks (16).
Fig 22: Figure A: Sagittal CT image of the thoracic spine shows a discogenic spur (red arrow).
Figure B: Sagittal T2-weighted image shows a discogenic spur with an associated anterior epidural collection (white arrows). Flow-related artefact is seen at the level of the spur – ‘Flow void’ sign (green arrow).
Figure C: Sagittal decubitus CT myelogram shows contrast from the subarachnoid space (yellow arrow), entering into the epidural space (black arrow).
For SLEC-negative leaks, the lateral decubitus position improves sensitivity, though CTM may still be negative in CSF–venous fistulae. Prominent paraspinal or small radicular veins on CTM may suggest a CVF (5,9).
Fig 23: Figures A–C. Lateral-decubitus myelography
Figure A: Patient is placed in the lateral decubitus position.
Figure B: Coronal lateral decubitus CT myelogram shows a diverticulum (yellow arrow) with a CSF venous fistula draining into the foraminal veins (green arrows).
Figure C: Illustration demonstrating the CSF venous fistula
Digital Subtraction Myelography (DSM)
DSM provides superior temporal resolution compared with conventional CTM but has limited anatomic coverage because it uses planar imaging. The lateral decubitus position is preferred for detecting CSF–venous fistulae (CVFs). Sensitivity can be improved using bilateral decubitus DSM on consecutive days and with respiratory modulation, which accentuates venous flow changes (10,17).
Fig 24: Figures A and B: Left-sided digital subtraction myelogram (DSM) demonstrates a diverticulum at the right D12 level (red arrow). A CSF venous fistula is seen arising from the diverticulum (red arrow) and draining into the paraspinal venous plexus (yellow arrow).
Dynamic Fluoroscopic Myelography
Performed in the Trendelenburg-position to promote caudocranial contrast flow, this real-time technique allows direct visualization of rapid contrast egress. It can demonstrate CSF-venous fistulas when contrast enters draining veins during the injection (18)
Fig 25: Figure A: Dynamic fluoroscopic myelogram shows a spinal diverticulum (red arrow) from which a CSF–venous fistula arises, draining into the lateral branches of the external vertebral venous plexus (white arrows).
MR Myelography (19).
Photon-Counting CT Myelography (20)
Table 26: Summary of myelographic techniques used in the evaluation of spinal CSF leaks, outlining their advantages and limitations.
MANAGEMENT
Hydration, bed rest, caffeine, and abdominal binders, though many patients show limited improvement.
- Epidural Blood Patch (EBP)
Targeted-EBP is preferred; empirical lumbar EBP is used when the leak cannot be localized.
- SLEC-Positive / Fast leaks: Ultrafast CT myelography for localization → targeted EBP (8–10 mL).
- SLEC-Negative: Empirical lumbar EBP may be performed.
Post-EBP care: ≥8 hours bed rest; avoid prolonged travel, heavy lifting, or Valsalva-like maneuvers. Follow-up at 10–14 days and 3–6 months.
Fig 27: A patient presenting with orthostatic headache was diagnosed with spontaneous intracranial hypotension (SIH) secondary to a spinal CSF leak.
Figure A: Sagittal T1-weighted image of the brain shows sagging of the brainstem and descent of the cerebellar tonsils (blue arrow).
Figure B: Scout image showing the patient positioned in the decubitus position for the procedure.
Figure C: Sagittal CT image demonstrating a discogenic spur at the D1–D2 level (red arrow).
Figure D: CT myelogram demonstrating a dural tear (black arrow) with contrast tracking from the subarachnoid space into the anterior epidural space (yellow arrow) through the dural tear.
Figure E: Targeted epidural injection performed at the same level (green arrow).
Figure F: Post-epidural blood patch - Resolution of brain sagging on follow-up MRI (white arrow).
CT-guided fibrin glue injection can be used after failed EBPs or for meningeal diverticula and CVFs.
Targeted fibrin glue injection or transvenous embolization of the draining vein using liquid embolic agents (e.g., Onyx).
Fig 28: Figure A: Coronal lateral decubitus CT myelogram demonstrates a diverticulum (green arrow) with a cerebrospinal fluid (CSF) venous fistula draining into the foraminal veins (white arrows).
Figure B: Digital subtraction myelogram confirms the CSF venous fistula with opacification of the foraminal veins (red arrow).
Figure C: Fluoroscopic image obtained following Onyx embolization of the CSF venous fistula (blue arrow).
Figure D: Post-embolization digital subtraction myelogram shows complete occlusion of the foraminal veins with no residual fistulous drainage (black arrow).
Evacuation of significant subdural collections; dural repair or spur removal for ventral tears; microsurgical ligation for diverticula or CVFs.
- Cerebral Venous Thrombosis: Standard anticoagulation.
POST-TREATMENT IMAGING
Most findings, venous distension, pituitary enlargement, brain sagging, and pachymeningeal enhancement, resolve within ~1 month. Subdural collections may take longer (10).
Fig 29: Post-CSF venous fistula embolization images.
Figures A-D: Follow-up MRI obtained 4 weeks later demonstrates resolution of the subdural hygromas (blue arrows) and normalization of previously distended venous sinuses (green arrows).