After HA, it is important to perform an initial evaluation: the anteroposterior radiograph is the best imaging modality.
What to look for in the immediate postoperative radiograph?
Positioning
The transischial line is used to measure the lateral inclination of the acetabulum. The angle between the transischial line and a line drawn across the superior and inferior acetabular rim should be 30-50 degrees
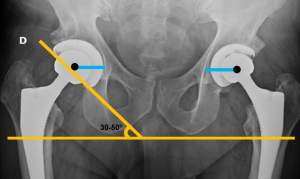
The transischial line is also used to assess lower limb dysmetria
The center of rotation of the femoral head should be at the level of the upper end of the greater trochanter and the distance between the center of the femoral head and the labrum (or other bilaterally identifiable point on the acetabulum) should be equal.
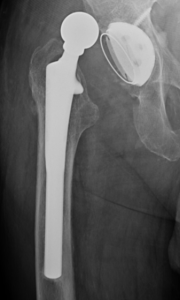
The femoral stem should be centered in the femoral canal. Varus malpositioning (distal tip against the lateral cortex) increases the risk of loosening and fracture.
Dislocation
The most common immediate complication, it can occur later, especially when the prosthesis is not well positioned or when there are other risk factors such as low muscle mass, trauma, loosening or osteoarthritis.
Periprosthetic fracture
This is a common immediate complication if there is a decrease in bone density or if the diaphyseal shaft is long or not centered in the femoral canal.
Cement extrusion
Usually asymptomatic. Rarely, entrapment of neurovascular structures or intestinal perforation may occur.
Normal/expected findings at follow up
The expected normal findings differ between cemented and non-cemented prostheses.
Periprosthetic radiolucencies may be normal or a sign of complications such as loosening, infection or particle disease.
Cemented prostheses
Ideally, radiolucencies at the bone-cement or cement-prosthesis interfaces should not be apparent, but they do occur.
A radiolucent zone between the prosthesis and the cement is a normal finding immediately after surgery, in the proximal zone of the diaphyseal shaft of the femur, which must be stable during follow-up. This is a result of suboptimal contact between the prosthesis and the cement. If this zone increases or appears only in the follow up, it signals a potential complication.
A radiolucent zone between the bone and the cement may also be a normal finding, due to the formation of a thin layer of fibrosis as a tissue response.
The description of the location of the radiolucencies at bone-cement interface should be standardized, both in the femoral and acetabular components. Charnley and Gruen zones present an anatomic division to report the location of radiolucent zones.

In the acetabulum, there are three zones (I, II and III). In acetabular zone I, a lucency of 1-2 mm is often seen at the bone-cement interface and corresponds to a normal finding as long as it is stable.
In the femur, a radiolucent zone in zone 1 or in zone 7 is commonly recognized, but these radiolucencies should not appear in the subtrochanteric zones (2-6).
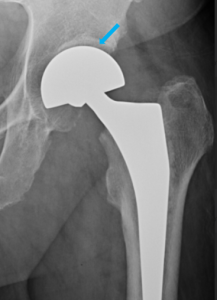
Non-cemented prostheses
Stable non-cemented prostheses can show radiolucent zones at the metal-bone interface. These radiolucent zones should remain stable and measure between 1-2 mm in thickness. We can also see a normal sclerotic line parallel to the radiolucent zone.
Proximal stress shielding can lead to calcar resorption, which corresponds to resorption in the area above the lesser trochanter, and proximal osteoporosis.
Distal stress loading can cause sclerosis at the tip of the prosthesis (known as “pedestal”) and cortical thickening.

Complications at follow up
The most common complications are loosening, periprosthetic fractures, and infection. Some complications may have similar appearance on radiographs.
The most important method for detecting complications is by comparing the current radiographs with previous ones.
Loosening
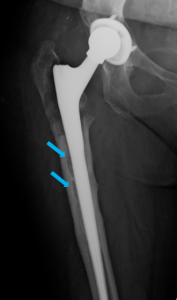
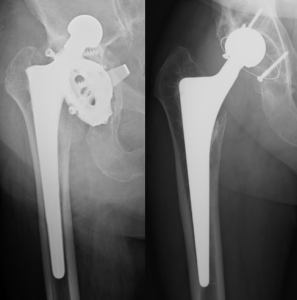
Loosening should be suspected if there is a radiolucency thicker than 2 mm at the prosthesis-bone interface (non-cemented prostheses) or at the prosthesis-cement interface (cemented prostheses), especially if several areas are involved and if there is documented progression in the follow-up.
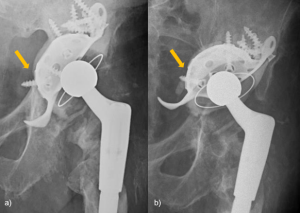
Component migration is never acceptable and is diagnostic for loosening. Presence of component migration is defined by upward inclination or cranial migration of the acetabular component or as subsidence (>10 mm) and varus tilting of the femoral stem.
As migration can be very subtle, it requires careful comparison with the initial postoperative films.
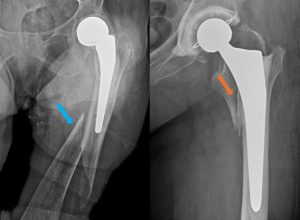
Particle disease
Particle disease is more common in non-cemented prostheses and occurs as a result of a macrophage reaction to small polyethylene wear particles.
Radiographically, particle disease translates into focal radiolucencies around the prosthesis, and particle migration resulting from polyethylene wear, which can be seen by sclerotic areas around the screws, and eccentric displacement of the femoral head.
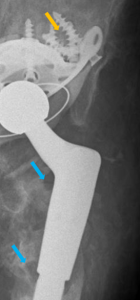
The differential diagnosis with prosthesis infection should be considered. In particle disease the radiolucencies are focal and there is no periosteal reaction. In contrast, cases of infection present as irregular lucencies with periosteal reaction.
Infection
Low grade infection may be unremarkable or may mimic loosening or small particle disease on radiographs.
The criteria for the diagnosis of infection of the prostheses have not been established.
Radiographic findings may include normal radiographs, radiolucencies indistinguishable from loosening or particle disease, irregular periprosthetic radiolucencies, periosteal reaction or irregular bone destruction with no sclerotic margins.
Irregular periprosthetic bone resorption with periosteal reaction is typical for infection.
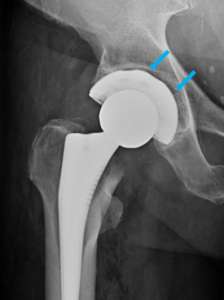
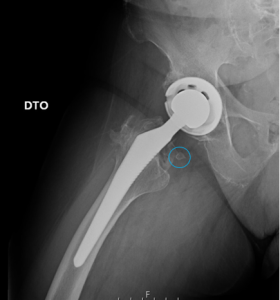
Component wear
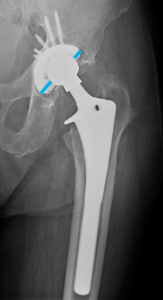
Normally, the head of the femoral component should be centered on the acetabulum. Abnormal loading of the polyethylene cup by the femoral shaft leads to more lateral pressure, resulting in wear of the polyethylene on the superolateral side and a characteristic radiographic finding: the asymmetrical positioning of the femoral head in the acetabular cup.
If the superolateral distance is less than the inferomedial distance, polyethylene wear should be suspected.
Dislocation
Dislocation can occur either in posterior, anterior or lateral direction at any of the components.
Fracture
Periprosthetic fractures can occur during surgery or later. They are more frequent with non-cemented prostheses intraoperativelly and on the femoral component.
In the Vancouver classification of periprosthetic femoral fractures, type A fractures are located in the trochanteric region, type B fractures occur around the femoral stem, and type C fractures are located well below the stem.
Heterotopic ossification
Heterotopic ossification occurs when primitive mesenchymal cells are transformed into osteoblastic cells that form mature lamellar bone.It typically occurs around the femoral neck and adjacent to the greater trochanter.
Classification of extent of bone formation (anteroposterior radiograph):
- Grade I: Islands of bone within soft tissues.
- Grade II: Bone spurs leaving >1 cm between opposing bone surfaces.
- Grade III: Bone spurs leaving <1 cm between opposing bone surfaces.
- Grade IV: Radiographic ankylosis of the hip.