Digital image database for chest radiographs
We applied the database for chest radiographs provided by the Japanese Society of Radiological Technology [14].
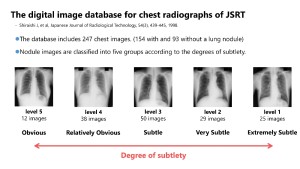
This database consists of 154 images containing nodules and 93 normal images. The nodule images are labeled into five levels based on their detection difficulty. This classification of difficulty was determined through the ROC experiment conducted by 20 observers. The original images are in DICOM format, with a matrix size of 2048 × 2048 pixels and a 12-bit grayscale. The dataset has a diverse range of subjects in terms of gender, age, and body type, presenting a variety of image appearances. Furthermore, the center coordinates of the nodule are provided, allowing identification of the exact location of the nodule on each image.
We attempted to quantitatively evaluate the difficulty of lesion detection in clinical images with a nodule in this database. To analyze with a Python program, the DICOM data was converted to 8-bit PNG data as a preprocessing step.
Overview of the PV-based ROC analysis procedure
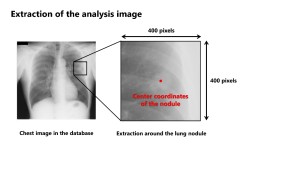
First, a 400 × 400-pixel region was extracted around the tumor, referring to the central coordinates.
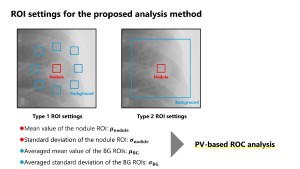
Then, to obtain statistical metrics of the nodule and the surrounding structures in the BG, such as the mean PV (μ) and the standard deviation (SD: σ), several region of interests (ROIs) were set. For the nodule, a 40 × 40-pixel ROI was set around the center coordinates. For the BG, two types of ROI settings were defined. In Type 1, eight 40 × 40-pixel ROIs were placed at a radial distance of 100 pixels from the nodule center to include the surrounding anatomical structures. In Type 2, a 300 × 300-pixel ROI including the nodule was defined. From the ROI set on the nodule, the values μnodule and σnodule were obtained. For the BG, the values from multiple ROIs around the nodule were averaged to obtain μBG and σBG.
Assuming normal distributions with parameters μ and σ for nodules and BG regions, respectively, the two normal distribution curves can be considered to be the same as the probability density functions (PDFs) used in ROC analysis. Therefore, if the false positive fraction (FPF), which is the horizontal axis of the ROC curve, and the true positive fraction (TPF), which is the vertical axis, are expressed as the inverse transformation of the PDF (z value), the result is explained by Equation (1) in Figure 4. The performance index da in ROC analysis is calculated from the difference in the mean values of the two distributions and the square root of the average of their variances (Equation (2)). Using this index da, the area under the ROC curve (AUC) is determined as Equation (3) [15].

We calculated the AUC in PV-based ROC analysis using the theoretical formula described above. The validity and usefulness of the developed method were verified by analyzing the correlation between the observer-AUC and the subtlety representing the difficulty of detection.