Quantitative Analysis
The paired samples t-test was used to statistically analyse all quantitative results between the two reconstruction groups.
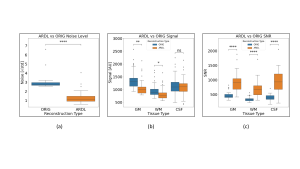
Noise was observed to have decreased by a factor of 2.22. Signal was found to be slightly higher in conventionally reconstructed scans than in ARDL reconstructed scans. Resulting SNR values show an overall significant difference in means between reconstruction types, with ARDL reconstructed images exhibiting higher SNR, (Fig .5).
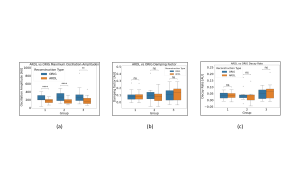
Mean maximum oscillation amplitude of Gibbs ringing showed a highly significant difference between reconstruction methods, with ARDL showing an average amplitude that was 1.5 ± 0.1 times lower than ORIG. The difference in the mean damping factor of Gibbs ringing and mean decay rate of the logarithmically transformed amplitudes show no statistical significance, (Fig .7).
Qualitative Analysis
Group 1 (no pathology) had a mean accuracy of 0.60 ± 0.079 (variance: 0.0051), meaning approximately 60% of the models predictions were accurate, with image A being correctly classified as either ORIG or ARDL based on the radiologists’ scores. Group 2 (subtle pathology) had a mean accuracy of 0.75 ± 0.189 (variance: 0.0299), and Group 3 (major pathology) had a mean 0.69 ± 0.108 (variance: 0.0097).
F1 scores provide a balanced measure of accuracy, considering both recall and precision, with 1 indicating perfect performance. F1 scores were 0.51, 0.69, and 0.45 for Groups 1, 2, and 3, respectively.
The following F1 scores for each individual image quality metric were also calculated. This provides insight into the relationship between the radiologists’ scores of each image quality metrics (noise, spatial resolution, artefact presence or detectability) and the ARDL reconstructed images.
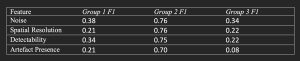
Independent variable coefficients were identical across metrics, suggesting high correlation and an inability to distinguish individual effects. This indicates that when one image quality metric was rated high, others were similarly rated, reflecting overall image quality improvement.
Inter-rater variability, measured using Fleiss’ Kappa, κ, showed a mean value of -0.0269 ± 0.0626 (variance: 0.00392) across all groups, indicating little to no agreement between raters.