In this observational retrospective trial, we included 116 patients with non-metastatic breast cancer diagnosis, studied with MRI before and after NACT, in the 2018 - 2023 period.
All patients were categorized according to age, weight, height and BMI. For all patients we collected histological cancer data and baseline TNM staging. We also evaluated the breast cancer MR response to neoadjuvant therapy using the RECIST v. 1.1 criteria and the type of response was related to the chemotherapy regimen applied. The radiological response to chemotherapy was related to histological analysis after surgical resection, calculating the accuracy of MRI in assessing response to neoadjuvant treatment.
To calculate MRI accuracy we considered histopatological analyses the gold standard and we divided the patients into the following categories: True-negative (TN): on both MRI and pathology; false-negative (FN): negative on MRI, but positive on pathology; true-positive (TP): positive on both MRI and pathology , and false-positive (FP): positive on MRI, but negative on pathology.
As in other literature studies, we categorized Pathologic response (TN) as:
- complete resolution of both invasive cancer and DCIS;
- resolution of invasive cancer with residual DCIS;
- microscopic residual invasive disease (<5mm).
We measured on both before and after-NACT MRI scans the PMA at the level of the sternal angle of Louis (manubriosternal joint at the level of the second cost cartilage), using T1 non-fat sat images and segmenting it manually using the “border follower” function included in the software Synapse 3D (Fujifilm Medical), obtaining an area measured in cm2.
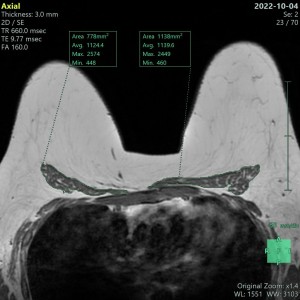
We analyzed separately left and right areas and bilateral area given by the sum of the two areas left and right.
Subsequently we calculated the difference in the values of the PMAs (left, right and bilateral) before and after chemotherapy (Delta pect), we do the same with the Pectoralis Muscle Index values:
- Riht PMA PRE-NACT: Mean 7,66 - SD 2,16; POST-NACT: Mean 6,61 - SD 1,69; DELTA: Mean 1,05 - SD 1,04.
- Left PMA PRE-NACT: Mean 7,62 - SD 2,29; POST-NACT: Mean 6,60 - SD 1,88; DELTA: Mean 1,03 - SD 1,00.
- Bilateral PMA PRE-NACT: Mean 15,28 - SD 4,19; POST-NACT: Mean 13,21 - SD 3,50; DELTA: Mean 2,61 - SD 6,12.
- PMI (cm2/m2) PRE-NACT: Mean 5,79 - SD ,66; POST-NACT: Mean 5,01 - SD 1,37; DELTA: Mean 0,79 - SD 0,68.
We also considered the CT scans performed by patients upon diagnosis of breast cancer. All CT scans were performed withGE Healthcare scanners (GE VCT Lightspeed, GE Optima), with a slice thickness of 2.5 mm and interval of 1.25 mm. We used the CT data to obtain the body composition parameters, processed using a Synapse 3D software. We selected unenhanced cross-sectional images at the third lumbar vertebra where both transverse processes were clearly identifiable. Regions of interest (ROI) were manually delineated using the software tool, aligning with the designated compartments for analysis. Within these ROIs, the software automatically computed the area expressed in square centimeters.
We considered:
- Right, left and Bilateral Psoas Muscles Area at the L3 level.
- Psoas muscle index: cross section psoas muscle area normalized with respect to stature (cm2/m2).
- Skeletal Muscle Area (cm2): obtained manually tracing a ROI encompassing the psoas muscles, paraspinal muscles (erector spine, quadratus lumborum, multifidus), and wall muscles (transversus, internal and external oblique, rectus abdominis) at the L3 level.
- Skeletal Muscle Index: cross-sectional SMA normalized with respect to stature and reported as cm2/m2, by calculating the ratio between the total area of lumbar muscles and the square of height.
We also evaluated body composition parameters of adipose tissue:
- Visceral fat area (cm2): calculated automatically using the Body Fat Analysis function included in Synapse 3D using the aforementioned density threshold
- Visceral Fat Index (cm2/m2): visceral fat area normalized for height expressed in cm2/m2.
- Subcutaneous Fat Area (cm2): calculated automatically, similarly to VFA, using the Body Fat Analysis function included in Synapse 3D using the aforementioned density threshold
- subcutaneous Fat Index (cm2/m2): subcutaneousfat area was normalized for height.
- Total fat area (cm2): the sum of the subcutaneous and visceral fat areas.
- Total fat index (cm2/m2): the total fat area was normalized for height.
In line with previous studies we classified the patients into sarcopenic or not sarcopenic using a CT skeletal muscle index cutoff for sarcopenia in women of 39 cm2/m2.
For patients who had both pre- and post-treatment CT scans, we calculated the differences in total skeletal muscle area, skeletal muscle index and visceral fat index.
We then analyzed the correlations between pectoral muscle values calculated at breast MRI and body composition parameters at CT. We analyzed in particular the correlations between the pectoral muscle parameters pre and post NACT and delta and the other body composition parameters related to the muscular and adipose compartment with analysis between continuous variables. We analyzed the changes in both the pectoralis major area estimated on MRI and the body composition parameters estimated on CT before and after chemotherapy treatment, evaluating their significance.
We then constructed the ROC curve (completed with AUC, sensitivity and specificity values) that describes the ability of the pectoral area to approximate the classification into sarcopenia and non-sarcopenia obtained from the SMI. With this analysis, a cutoff for the pectoral area was identified that best discriminates sarcopenic subjects from non-sarcopenic ones (according to the SMI cutoff used).