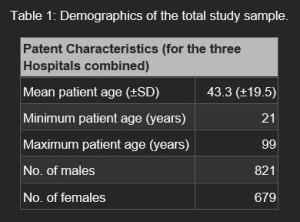
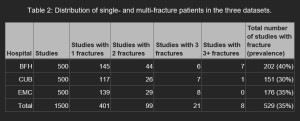
Baseline characteristics: Data was collected consecutively from April 30th 2018 through June 30th 2018 at BFH, from April 30th 2021 through June 25th 2021 at CUB and from April 30th, 2022 through July 4th, 2022 at EMC according to the eligibility criteria until a total of 500 cases was reached for each hospital. No cases were excluded based on the exclusion criteria. Mean age was 43.3 ± 19.5 years and consisted of 821 male and 679 female patients. The demographics and data characteristics are displayed in Table 1 and Table 2.
Of the 1500 cases, information from secondary imaging was available on 8% of the cases (123/1500). The information from secondary imaging impacted the definition of the reference standard in 0.2% of the cases (3/1500).
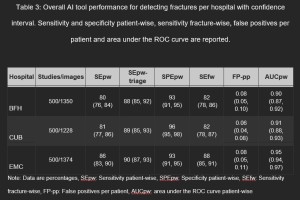
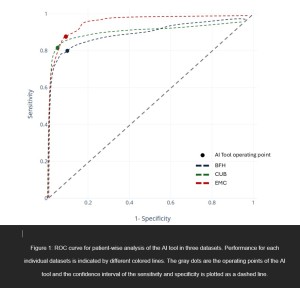
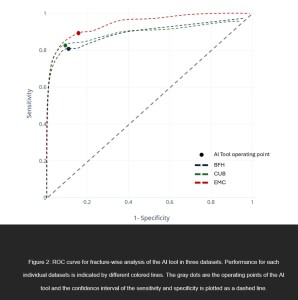
Performance metrics per hospital: The resulting performance metrics for the local datasets are displayed in Table 3. We found no evidence of differences for SEpw, SPEpw, SEfw, and FP-pp in the overall metrics, but the AUCpw of EMC (0.95 95% CI: 0.94, 0.97) was higher than the AUCpw of BFH (0.90 95% CI: 0.87, 0.92; p < .001) and CUB (0.91 95% CI: 0.88, 0.93; p = 0.006). However, we observed no significant differences between the AUCpw of BFH and CUB (p = 0.49). The ROC curves for the patient-wise and fracture-wise analyses are plotted in Figure 1 and 2.
Subgroup analysis by anatomy group: For the subgroup analysis, the data was grouped into six anatomical subgroups based on the imaged anatomy, namely ankle/foot/toe, arm/elbow, wrist/hand/finger, shoulder, hip/pelvis and leg/knee. The results are displayed in Table 4. The subgroup for leg and knee did not meet the criteria for minimum number of positive fractures of 20 at BFH(14), CUB(16), and EMC(16). Also, the subgroup for shoulder or hip/pelvis did not meet the minimum criteria for number of positive fractures at CUB(13/17), and EMC(13/4).
