Using a free CAD software a 3D computer model of a cube with a size of 20 mm x 20 mm x 20 mm was generated and exported as an STL file, to serve as a test object. The object was loaded in a slicing software in order to be prepared for 3D printing. The cube was duplicated, resulting in a total of thirty cubes, which were separated in three groups and each group was assigned different infill pattern. The three patterns considered for evaluation were the Line, Grid and Gyroid patterns. Furthermore, to study the influence of the infill, an infill percentage from 10% to 100%, with a 10% step, was considered for each pattern. Walls as well as top and bottom layers were set to zero, meaning they will not be 3D printed and only the infill will, as seen from
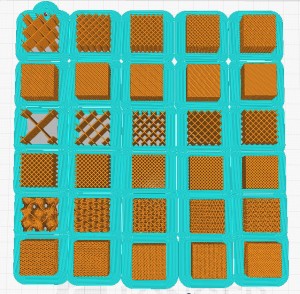
A brim was also added in order to increase the adhesion to the printing bed and avoid warping of the cubes.
A low-cost hobbyist-level FFF 3D printer and a generic PLA filament were selected for printing the cubes, given the demonstrated versatility of such printers in medical applications and the suitability of PLA as a building material [1-4]. Aside from the specified adjustments made for 3D printing the cubes, all other settings remained standard for PLA, with a 0.2 mm layer height. The samples were grouped and scanned together at a clinical computed tomography (CT) facility with three different anode voltages – 80 kV, 100 kV and 120kV. Consequently, the HU values of the resulting CT images were measured by defining a Region of Interest (ROI) inside each cube and calculating the mean and standard deviation across twenty consecutive slices.