1. DIFFERENTIATING BETWEEN RESIDUAL TUMOUR, FIBROSIS, AND OEDEMA
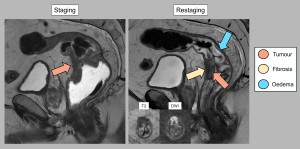
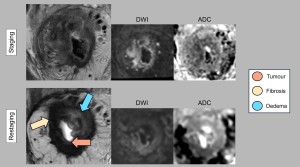
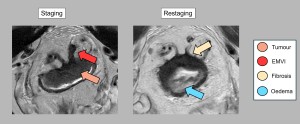
After treatment, residual tumour, fibrosis and oedema often overlap, making differentiation difficult. Accurate pre-treatment localisation and analysis of tumour characteristics are essential to overcome this problem. Post-treatment changes may mimic residual tumour in adjacent or even contralateral areas. Evaluations should compare the current tumour bed with the original tumour location to avoid misinterpreting responses in previously unaffected areas. The addition of diffusion weighted imaging (DWI) sequences has been shown to be beneficial. The key findings for differentiation are summarised below (Figures 1 and 2):
- Residual tumour: T2 signal persists similarly to the initial MRI, with restricted diffusion indicating high cellular density. While T-staging criteria remain unchanged from initial staging, caution is advised as the depth of tumour invasion is difficult to assess in areas of post-treatment change [2].
- Fibrosis: Fibrosis is an indicator of a favourable response and appears as areas of low T2 signal within the tumour bed. However, the complete absence of tumour cells within fibrosis cannot always be guaranteed, particularly in thicker fibrotic tissue. In some cases, restricted diffusion within the fibrosis is observed, probably due to persistent inflammation.
- Oedema: After treatment, submucosal oedema manifests as a thickened bowel wall with high or intermediate T2 signal. Its long relaxation time may also increase signal intensity on diffusion weighted images and ADC maps [3,4].
2. ASSESSING NODAL RESPONSE
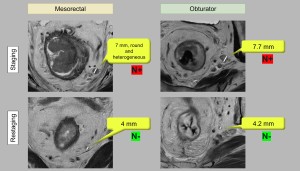
Criteria for nodal involvement vary according to the lymphatic chain and differ from staging criteria (Figure 3).
Regional nodes
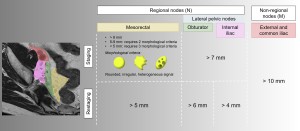
These define the N category. The distinction between mesorectal and superior rectal nodes and lateral pelvic nodes (obturator and internal iliac nodes) is critical:
- Mesorectal nodes: A short axis diameter >5 mm is the most reliable predictor of tumour invasion. Morphological criteria (shape, margin, signal homogeneity) do not significantly improve diagnostic accuracy in restaging. These nodes are routinely removed during total mesorectal excision (Figure 4).
- Internal iliac and obturator nodes: Nodes are considered likely to be involved if their short axis diameter exceeds 4 mm (internal iliac) and 6 mm (obturator) (Figure 4). Surgical resection is recommended in these cases as it is associated with excellent survival. However, it is not routinely performed due to the high risk of bladder and sexual dysfunction.
- Internal iliac nodes: Includes all lymph nodes adjacent to the internal iliac artery and its branches from its origin to where the terminal branches leave the infrapiriform foramen.
- Obturator nodes: Located along the internal iliac vessels at the edge of the pelvis, at the level of the external iliac vessels in the centre of the pelvis and below the infrapiriform foramen.
Non-regional nodes
- These include external iliac, common iliac and inguinal nodes and are classified as distant metastases (category M). Although there are no clear size criteria, their presence is associated with an increased risk of distant recurrence [5-8].
3. WHEN TO REASSESS?
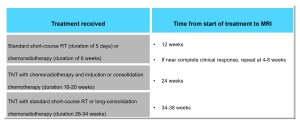
The optimal time for post-treatment MRI in rectal cancer varies because of the delayed effects of radiotherapy. The timing of reassessment depends on the type of therapy (Figure 5).
Timing recommendations:
- For short-course radiotherapy or chemoradiotherapy, MRI is recommended between 4 and 12 weeks after treatment.
- In total neoadjuvant (TNT) strategies, reassessment may be extended to 24 or even 38 weeks.
- Earlier assessment may be valuable in identifying patients with poor response and allowing timely adjustment of clinical management.
Reassessment is critical for tailoring treatment strategies:
- In cases of complete response, non-surgical strategies may be considered.
- For suboptimal responses or local progression, treatment plans can be adjusted accordingly.
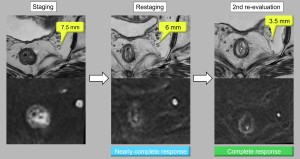
- If a near complete clinical response is observed, further reassessment may be warranted as there is potential for conversion to a complete response [2,9,10] (Figure 6).
4. MESORECTAL FASCIA, PERITONEAL REFLECTION, AND VASCULAR INVASION
Accurate post-treatment identification of these three elements is essential to assess tumour response, fibrosis and metastatic risk.
Mesorectal fascia (MRF)
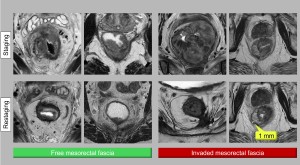
MRI plays a critical role in determining whether the MRF is free or infiltrated, which guides surgical planning. The MRF appears as a hypointense T2 line surrounding the mesorectal fat.
- Free MRF: Defined as the tumour >1 mm from the fascia, which is associated with a lower risk of recurrence.
- Infiltrated MRF: Defined as tumour ≤1 mm from the fascia.
After treatment, the distinction between fibrosis and residual tumour becomes difficult, reducing diagnostic accuracy. Resolution of MRF invasion or the appearance of fine fibrotic changes without tumour signal indicates a favourable response. Conversely, nodular or thicker areas make it difficult to exclude residual tumour cells (Figure 7).
Peritoneal reflection
This is particularly important for tumours in the upper rectum. After chemoradiotherapy, MRI may show resolution of invasion, with fibrotic changes suggesting a favourable response. The absence of tumour signal in these regions is a good prognostic indicator (Figure 8).
Extramural vascular invasion (EMVI)
EMVI, the invasion of vessels by tumour cells, is a poor prognostic factor. On MRI, it appears as an intermediate signal lesion that enlarges the venous lumen. Regression of EMVI after treatment is associated with improved survival. Persistent EMVI increases the risk of recurrence. Fibrosis within the vessels on T2 sequences indicates a good response to treatment [11-14] (Figures 8 and 9).

5. GLOBAL ASSESSMENT OF RESPONSE
Classification of tumour response is critical for personalised decision making in patients with rectal cancer. Traditionally, pathologists have used tumour regression grade in resected surgical specimens (pTRG). Its MRI-based equivalent, MRI tumour regression grade (mrTRG), is based on T2-weighted sequences. While the MERCURY study showed that mrTRG is a better predictor of survival than post-treatment T and N stages, it has limitations, including low concordance with pCR, a sensitivity of 74.4%, specificity of 62.8% and significant inter-observer variability. In addition, mrTRG does not take into account lymph node assessment or diffusion weighted imaging (DWI) [15,16].
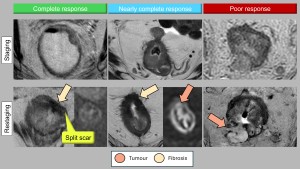
To address these shortcomings, international consensus guidelines have simplified response grading into three categories: complete response, near complete response and poor response. Unlike mrTRG, this system integrates T2 and DWI sequences and includes lymph node assessment:
- Complete response: No visible tumour on T2 and DWI sequences and no suspicious lymph nodes (all <5 mm).
- Near complete response: Significant tumour volume reduction with some residual high signal areas on DWI and partial regression of affected nodes.
- Poor/Incomplete response: Minimal tumour or nodal regression, indicating ineffective treatment [10] (Figure 10).
cCR findings include complete disappearance of tumour signal, absence of diffusion restriction and, in some cases, normalisation of the rectal wall. Although rare, wall normalisation is a favourable sign. A specific morphological pattern indicative of cCR is the "split scar" sign, which has a high specificity (97%) for durable complete responses (Figure 10). This pattern appears as a low intensity fibrotic scar on T2 involving the submucosa, an intermediate intensity layer in the muscularis propria and a third hypointense layer corresponding to perirectal fibrosis [17].