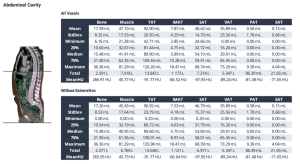
After applying inclusion and exclusion criteria, our study included 155 patients with histologically confirmed GC who underwent diagnostic and/or therapeutic procedures at the University Hospital Frankfurt between 2013 and 2023. A pre-selected series of thoracoabdominal CT-scans were automatically analyzed using the open-source body and organ analysis (BOA) algorithm by Haubold et al [8]. The resulting body composition parameters analyzed included bone, muscle, total adipose tissue (TAT), intermuscular adipose tissue (IMAT), subcutaneous adipose tissue (SAT), visceral adipose tissue (VAT). A snippet of the results section for tissue segmentation and quantification, generated by the BOA algorithm, is shown in Figure 1.
To combine the analyzed parameters and derive more robust predictive markers for overall and progression free survival in patients with GC, we studied the effects of sarcopenia by calculating the muscle to bone ratio (MBR) and sarcopenia marker. As it has been previously published, we calculated the MBR by dividing abdominal muscle volume by bone volume and muscle volume/(bone volume + IMAT) for the sarcopenia marker [9;10]. Additionally, we evaluated the impact of these parameters on OS and PFS. The applied inclusion and exclusion criteria are illustrated in the following flowchart.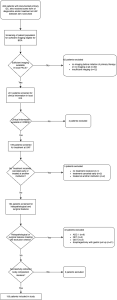
We used univariate and multivariate Cox proportional hazard analyses to assess the relationship between bone, muscle, TAT, IMAT, SAT, VAT, muscle-to-bone ratio (MBR), and all possible tissue ratios (e.g., VAT/TAT) with OS and PFS. Variables with significant p-values in univariate analysis were further analyzed in multivariate models, adjusted for body composition parameters, age, and sex. Hazard Ratios (HRs) and 95% confidence intervals (CIs) were computed for all indicators affecting OS or PFS. OS and PFS were compared using Kaplan-Meier survival plots and log-rank tests, with optimal cut-off points determined via the surv_cutpoint function (R package survminer). Standardized mean differences in baseline characteristics between curative and palliative cohorts, as well as pre-therapeutic laboratory parameters, were assessed using Welch’s t-test for continuous variables. Baseline characteristics were reported as mean and interquartile range (IQR), while laboratory parameters included mean, IQR, and range. Categorical variables, including risk factors, histopathology, and treatment approach, were analyzed using Fisher’s exact test (frequencies <5) or Pearson’s Chi-squared test (≥5). P-values ≤ 0.05 were considered statistically significant. Statistical analyses and visualizations were conducted in RStudio using dplyr, gtsummary, survival, survminer, ggplot2, and forestploter.