MRI could not be performed in 10/175 (5.7%) patients due to contra-indications, claustrophobia, or severe discomfort in obese patients (mostly teenagers), and thus no MR data was acquired. In addition, MRE measurements were not acquired in 20/175 (11%) additional patients due to technical issues and severe discomfort in obese patients, while the shear wave amplitude was too weak to be accurately detected and to allow accurate measurements in 13/175 (7%) additional patients. US-ATI measurements were not collected in 11/174 (6%) patients due to technical issues or unsaved measurements. However, US measurements were successful in all patients when the system was available.
The adult population included 75 patients with a median age of 60 (min 17 – max 79), a median weight of 90 kg (min 46 – max 174) and a median BMI of 31.6 (min 21 – max 47); the teenager population included 100 patients with a median age of 14 (min 8 – max 16), a median weight of 100 kg (min 46 – max 188), and a median BMI of 36.4 (min 25 – max 56).
The distribution of MR-PDFF among the adult and pediatric population was significantly different, as determined by the Chi-Square test of independence (p<0.001). The median MR-PDFF is 15.6% (min 0.5% – max 46.5%) on the adult population and 5.9% (min 1.2% - max 32.7%) on the teenager population. The distribution of MR-E among the adult and pediatric population was significantly different (Chi-Square test of independence: p<0.001). The median MR-E is 3.14 kPa (min 1.52 kPa – max 8.48 kPa) on the adult population and 2.26 kPa (min 1.4 kPa – max 3.71 kPa) on the teenager population. The adult group has fatter and stiffer livers than the teenager group. In addition, the distribution of MR-PDFF from ROI1 and ROI2 was significantly different according to the Wilcoxon signed-rank test (p<0.05), but MR-E distributions from those two ROI were not significantly different (p = 0.15).
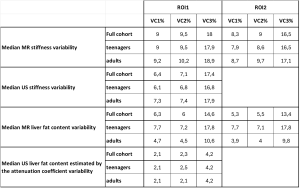
Median VC1, VC2 and VC3 are displayed on Table 1.
Differences in variability between MR and US biomarkers
There was no significant difference in variation coefficients between MR-E (from ROI1 and ROI2) and US stiffness SWE according to the Wilcoxon signed-rank test (p > 0.05) when either computed on the full cohort, on teenagers, or adults only, except for VC2 from ROI1 on the full cohort and on teenagers (p = 0.006 and p = 0.003, respectively). ROI1 VC2 were higher on MRE than on SWE.
On the contrary, the Wilcoxon signed-rank test demonstrated that VC1, VC2 and VC3 were significantly different between MR-PDFF (from ROI1 and ROI2) and US-ATI on the three different populations: the full cohort, teenagers, or adults only, with higher variability coming from MR-PDFF measurements than US-ATI. The median variability was almost 3 times higher when calculated on MR-PDFF both from ROI1 and ROI2 than on US-ATI. More specifically, there was a factor of 3.7 for VC1, 2.8 for VC2 and 4.2 for VC3 between US-ATI and MR-PDFF on ROI1, on the teenager population. On the adult group, the median variability was about twice as high on MR-PDFF compared to US-ATI measurements.
Differences in variability between adult and teenager populations
VC1, VC2 and VC3 MR-PDFF were significantly different in adults and teenagers according to the Mann-Whitney test (p < 0.05). However, US-ATI variability was not significantly different between populations (Mann-Whitney: p > 0.05). Median variability of MR-PDFF was about 1.6 higher in teenagers than in adults, whereas US-ATI variability was the same in teenagers and adults.
Table 1 shows that MR-E and SWE stiffness have similar median variation coefficients in the two groups. The Mann-Whitney test confirmed that there was no significant difference between VCs from the teenager and adult groups, for MR-E and SWE (p > 0.05).
Differences in variability between ROI1 and ROI2:
No significant differences were found between ROI1 and ROI2 for all MR-PDFF variability coefficients and for MR-E VC3, according to the Wilcoxon signed-rank test (p > 0.05). However, MR-E VC1 and VC2 were significantly different (Wilcoxon: p = 0.04).