Back to the list
Congress: ECR25
Poster Number: C-28044
Type: Poster: EPOS Radiologist (scientific)
Authorblock: S. Sauranen, T. Mäkelä, T. Kaasalainen, M. Kortesniemi; Helsinki/FI
Disclosures:
Sara Sauranen: Nothing to disclose
Teemu Mäkelä: Nothing to disclose
Touko Kaasalainen: Nothing to disclose
Mika Kortesniemi: Nothing to disclose
Keywords: Artificial Intelligence, Computer applications, Radiation physics, CT, Physics, Technology assessment, Quality assurance
Results

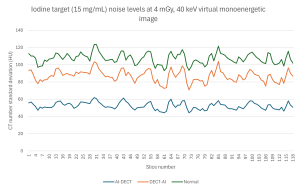
The noise levels in all targets and maps decreased significantly (p < 0.05), by a mean reduction of 28 HU, in the two AI noise-reduced image sets compared to the images with no AI noise reduction. Noise reduction was greater, by 6 HU on average, in images in which AI noise reduction was applied to the X-ray tube A and B data than when it was applied to the DECT maps with a few exceptions across specific phantom targets and maps. In the images with X-ray tube A and B data noise reduction the noise was from 5 to 136 HU (mean 31 HU) lower than in the images with no AI noise reduction. The images with DECT map noise reduction had 3 to 95 HU (mean 25 HU) lower noise than the images with no AI noise reduction. An example of the different noise levels of an iodine target in a subtraction image across the phantom z axis (all slices included) is shown in Figure 2.  

Fig 2: Iodine target (15mg/mL) noise levels at 4 mGy, 40 keV virtual monoenergetic image.
The impact on contrast was more complex, and the changes were less pronounced and less statistically significant. The contrast was lower by a mean of 2 HU in the two AI noise-reduced images than in the images without AI noise reduction. In both AI noise-reduced versions, the contrasts showed both increases and decreases depending on the dose level, phantom target, and DECT map. Compared to the images with no AI noise reduction, the changes in contrast varied between +43 and -47 HU with a mean of -1 HU in the images with X-ray tube A and B data noise reduction, whereas in the images with DECT map noise reduction, the changes were between +7 and -36 HU with a mean of -2 HU. An example of the different contrast levels of an iodine target across the phantom z axis (all slices included) is shown in Figure 3.  
Fig 3: Iodine target (15mg/mL) contrast levels at 4 mGy, 40 keV virtual monoenergetic image.
The study limitations included challenges in ROI positioning, especially considering the smallest iodine targets, with related segmentation and subsequent HU measurements; usage of a single CT scanner, reconstruction and DECT post-processing software; and usage of a single phantom model which does not cover the full range of clinical representations and variance in actual patient populations.

GALLERY