Table 1 showed the acquisition parameters and Dg displayed during mammography examinations according to the thickness of the compressed breast. A comparison of the two calculation methods based on the Boone and Dance models showed a statistically significant increase (p<0.05) in doses calculated by the Dance method, regardless of breast thickness (Figure 1). Acquisition parameters were not statistically different (p=1). The greatest differences were observed for the smallest breast thicknesses (<65mm). Results for 85-95mm breast thickness were not representative as few patients make up this group.
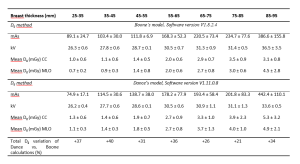
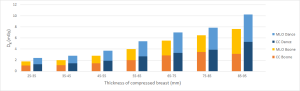
Figure 2 illustrated the temporal evolution of the cumulative doses from the craniocaudal and the medio-lateral oblique incidences for standard breast thicknesses. When the calculation method was changed from Boone to Dance, the average increase of diplayed Dg was 21%. The mean entrance dose (ESD) increased by 29% from 5.2 ± 1.2 mGy to 6.7 ± 0.5 mGy due to the change in the calculation reference point between the two software versions. However, this was not statistically different (p=0.15).
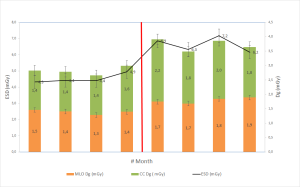
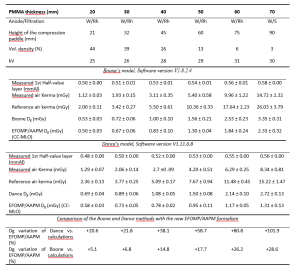
Table 2 showed the impact of the change to the new EFOMP/AAPM formalism on the displayed Dg on a phantom study. The results suggested that when switching from Dance's model to this new formalism, it was expected that the displayed Dg would decrease by a significant amount (p<0.05). This decrease from the thinnest to the thickest breast thickness ranged from 21% to 102%. The results also showed a significant decrease in Dg when switching from Boone's model to EFOMP/AAPM formalism (p<0.05). This decrease became more pronounced with increasing breast thickness. Compared to switching between Dance and EFOMP/AAPM, Dg was reduced less, ranging from -5% to -29%. HVL and Kair were not statistically different between both models: (p=0.2).
The question of how well the estimate of Dg with PMMA phantoms during external quality control agrees with the average patient Dg is of interest4. For the 45-55 mm range of clinically compressed breast thickness, the ratios between clinical Dg and the value obtained on the phantom for 45 mm thickness with 26% glandularity were 1.4 and 1.7 for Boone and Dance, respectively. For each of the calculation methods (Boone and Dance), the Dg values calculated from the phantom measurements were lower than the Dg displayed in the clinic, regardless of the thickness studied.