LIGAMENTOUS ANATOMY:
PRIMARY STABILISERS 
Transverse Atlantal Ligament (TAL)
TAL is a thick band posterior to dens attached to tubercles of atlas.
Allows free gliding motion to occur over the posterior facet of the dens.
TAL effectively limits anterior translation and flexion of the atlantoaxial joint.
Alar Ligaments:
Two strong cords attached to the dorso- lateral body of the dens & extend laterally & rostrally.
They are ventral & cranial to the transverse ligament.
The alar ligament allows an anterior shift of C1 from 3 to 5 mm.
SECONDARY STABILISING LIGAMENTS 
- Apical ligament
- Anterior AOmembrane
- Anterior Longitudinal Ligament, ALL
- Tectorial membrane
- Posterior A-O membrane
- Ligamentum Flavum
- Posterior Longitudinal Ligament, PLL
CRANIOMETRY
Chamberlain's line
From the posterior pole of the hard palate to the opisthion. 
A tip of the odontoid 6.6 mm or more above this line is considered diagnostic for basilar invagination.
Mc Rae Line
From the anterior margin of the foramen magnum to the posterior margin.
Atlanto- Dental interval
Distance between the posterior border of the anterior arch of the atlas and the anterior border of dens.
<3mm in adults and <5mm in children. An increase in ADI is suggestive of atlantoaxial dislocation
Posterior Atlanto- Dental interval
Measured from the dens's posterior border to the posterior tubercle's anterior border. It should not be less than 13mm.
Wecken-Heim Clivus base line:
Drawn along the clivus and extrapolating it inferiorly into the upper cervical spinal canal.
It should fall tangent to the posterior aspect of the tip of the odontoid process.
If it falls too far posterior to the odontoid posterior craniocervical dislocation
If it intersects the body or base of the odontoid anterior craniocervical dislocation. 
Clivus Canal angle:
The Wackenheim line forms the angle & a line constructed along the posterior surface of the axis body and odontoid process.
The angle ranges typically from 1500 in flexion to 1800 in extension.
Ventral spinal cord compression may occur with angles less than 150.
Welcher Basal Angle:
Angle formed at the intersection of the nasion tuberculum line and the tuberculum-basion line.
It should always be less than 140°. More than 140 is s/o platybasia.
Atlanto-occipital joint Axis Angle
It is formed by lines drawn parallel to the atlanto-occipital joints, which typically intersect at the center of the odontoid process.
The average angle is 125° and becomes more obtuse in the case of occipital condylar hypoplasia.
PATHOLOGICAL CONDITIONS 
Congenital
Anomalies of skull base
- Platybasia
 Fig 7: Skull Base Anomalies: Platybasia Dysplasia An abnormally obtuse basal angle, measuring 149*, is seen on the reformatted CT image (A) and on the sagittal T1W image (B). There is associated basilar invagination, occipitalisation of atlas & ventral cervicomedullary cord compression.
 - Basilar Invagination
 Fig 8: Skull Base Anomalies: BASILAR INVAGINATION Violation of the chamberlain's line is diagnostic of BI. 2 Types Group A: Violation of Chamberlain’s line and Mc Rae line disturbance. Group B : Violation of Chamberlain’s line w/o disturbance of Mc Rae line.
 - Condylar hypoplasia
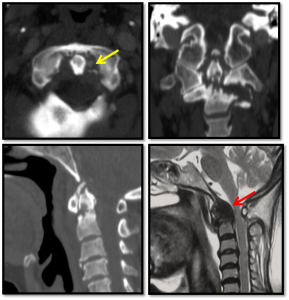
 Fig 9: Skull Base Anomalies: NCCT Coronal image showing Condylar Hypoplasia occipital condyle: clivus- canal angle is decreased, and the underlying cervicomedullary junction severly compressed. short clivus and bowstring deformity of cervico edullary junction . Sagital T1 MRI image showing Basiocciput Hypoplasia clivus-canal: occipital condyles are underdeveloped and have a flattened appearance, leading to BI and widening of the atlantooccipital joint axis angle (>125)
 - Basi-occiput dysgenesis Fig 9: Skull Base Anomalies: NCCT Coronal image showing Condylar Hypoplasia occipital condyle: clivus- canal angle is decreased, and the underlying cervicomedullary junction severly compressed. short clivus and bowstring deformity of cervico edullary junction . Sagital T1 MRI image showing Basiocciput Hypoplasia clivus-canal: occipital condyles are underdeveloped and have a flattened appearance, leading to BI and widening of the atlantooccipital joint axis angle (>125)
- Foramen magnum stenosis
 Fig 10: Skull Base Anomalies: Foramen magnum stenosis Sagittal T1W (A) T2W (B) MR images of a 9 mo achondroplasic child showing narrowing of the FM with compression of ervicomedullary junction. Associated prominent forehead with depressed nasal bridge and J-shaped sella are also noted.
 - Clivus segmentations anomalies
Atlas malformations 
- Bifid atlas
- Assimilation
- Absent arches
Odontoid dysgenesis
Aware of embryological variants of Os odontoid 

- Odontoid Aplasia
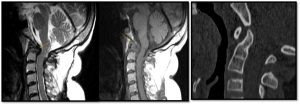
 Fig 18: ANOMALIES OF DENS: OODONTOID APLASIA Sagittal T1W (A), T2W (C) & coronal T2W (B) MR images showing aplastic dens. Additional findings include platybasia, short clivus and syrinx involving the cervical spinal cord.
 - Os odontoideum
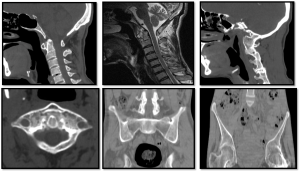
 Fig 16: ANOMALIES OF DENS: OS OODONTOIDEUM Sagittal MRI (A,B) & CT (C) images : showing rounded bony fragment lying above and anterior to the base of dens. Dens is hypoplasticstic, smooth and well corticated and Anterior arch is hypertrophied and rounded differentiating the condition from fracture. Additional findings on MR include marked ligament thickening, spinal canal narrowing with cord compression and myelomalacic changes
 Fig 17: TYPE 2 FRACTURE verses OS-ODONTOIDEUM
 - Os Avis
 Fig 15: EMBRYOLOGICAL VARIANTS OF DENS: PERSISTENT OS-TERMINALE & OS- AVIS
 - Persistent Os-terminale Fig 15: EMBRYOLOGICAL VARIANTS OF DENS: PERSISTENT OS-TERMINALE & OS- AVIS
Atlanto-axial dislocation 
Acquired
- Traumatic
- Degenerative
 Fig 20: DEGENERATIVE CHANGES AT CVJ Secondary degenerative changes in patients with multiple segmentation anomalies (A to C): Reduced ADI with sclerosis and osteophytes formation. The fluid signal is noted in the predental space, which normally contains fat/soft tissue. Also seen is Group B Basilar invagination. Blue : Chamberlain’s Line & Yellow :Mc Rae Line.
 - Inflammatory:
- Infectious: TB
 Fig 24: Tuberculosis: Sagittal reformatted CT (A & B) images show areas of osseous destruction involving the axis and C3 with associated prevertebral collection. Sagittal T2W (C) and sagittal post contrast T1W (D) MR images show rim enhancing prevertebral collection with epidural extension causing cord compression.
 - Noninfectious:
RA & JRA
CPPD
Ankylosing Spondylitis
Reiters
4. Neoplastic
- Primary
 Fig 25: TUMOURS INVOLVING CVJ 1.Foramen Magnum meningioma: Sagittal T2(A),T1(B) & Post GAD (C) images showing well defined dural based homogenous enhancing mass, isointense on T1 & iso to hyperintese on T2 seen along anterior foramen magnum causing compression on CMJ 2. Multiple Myeloma: Axial & reformatted sagittal CT images (A & B) showing well defined lytic lesion involving lower part of odontoid. Multiple other well defined lytic bony lesions were present in skull and spine.
 - Metastasis Fig 25: TUMOURS INVOLVING CVJ 1.Foramen Magnum meningioma: Sagittal T2(A),T1(B) & Post GAD (C) images showing well defined dural based homogenous enhancing mass, isointense on T1 & iso to hyperintese on T2 seen along anterior foramen magnum causing compression on CMJ 2. Multiple Myeloma: Axial & reformatted sagittal CT images (A & B) showing well defined lytic lesion involving lower part of odontoid. Multiple other well defined lytic bony lesions were present in skull and spine.