Congress:
ECR25
Poster Number:
ESI-25394
Type:
EuroSafe Imaging Poster
Authorblock:
J. S. D. M. Tapajos, L. L. Tapajos, L. Cavalcante, V. Guttemberg; Manaus/BR
Disclosures:
Juliana Santana De Melo Tapajos:
Nothing to disclose
Luciano Leitao Tapajos:
Nothing to disclose
Leonardo Cavalcante:
Nothing to disclose
Victor Guttemberg:
Nothing to disclose
Keywords:
Radioprotection / Radiation dose, CT, Physics, Radiation safety, Dosimetric comparison, Quality assurance
525 patients were evaluated, with a mean age of 40.2±13.1 years (range 18 to 95 years), most frequently female (55.4%) and overweight (41.5%).The distribution of patients according to anatomical site/clinical indication was equally 175 individuals (33.3%) for the abdomen, head and chest. Patients undergoing chest CT were older than those undergoing head CT (P<0.001). The height of patients undergoing abdominal CT was greater than the height of patients undergoing head CT (P=0.011). Women more frequently underwent head CT, while men underwent abdominal CT (P<0.001). Other comparisons and associations did not show a statistically significant difference

Table 1: Table 1. Sociodemographic and anthropometric characteristics of patients undergoing computed tomography at each anatomical site, conducted at a medical reference center in Manaus (AM), N=525.
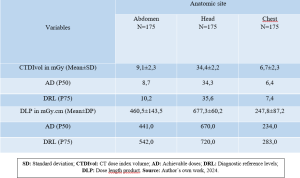
Table 2: Table 2. AD and DRL, based on CTDIvol and DLP values, for different anatomical sites of patients undergoing computed tomography at a medical reference center in Manaus (AM).
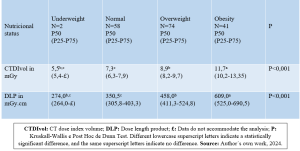
Table 3: Table 3. Comparison of medians (P50 or ACHIEVABLE DOSE) and interquartile range lower (P25) and upper limits (P75 or DRL) of CTDIvol and DLP, according to the nutritional status of patients undergoing abdomen computed tomography at a medical reference center in Manaus (AM), N=175.
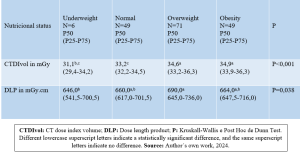
Table 4: Table 4. Comparison of medians (P50) and interquartile range lower (P25) and upper limits (P75) of CTDIvol and DLP, according to the nutritional status of patients undergoing head computed tomography at a medical reference center in Manaus (AM), N=175.
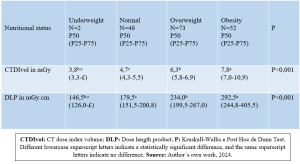
Table 5: Table 5. Comparison of medians (P50) and interquartile range lower (P25) and upper limits (P75) of CTDI and DLP, according to the nutritional status of patients undergoing chest computed tomography at a medical reference center in Manaus (AM), N=175.