Fluoroscopy
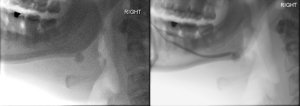
Fluoroscopic sialography requires cannulation of the main parotid or submandibular duct. Retrograde opacification of the ductal system is achieved by injecting a water-soluble iodinated contrast medium under fluoroscopic imaging, with or without digital subtraction.
Several potential challenges exist. Some patients may be difficult to cannulate – influencing factors include operator skill and experience, patient tolerance, and anatomical variations or underlying pathology (e.g. stenoses).
When successfully performed, fluoroscopic sialography provides excellent spatial resolution and allows for precise localisation of stones, strictures, and sialectasis [5].
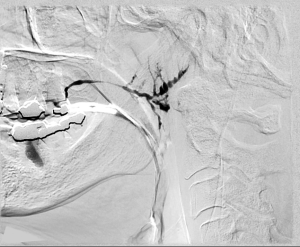
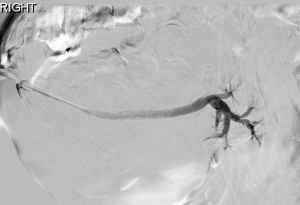
Figure 1 – 3 demonstrate examples of pathology on fluoroscopy.
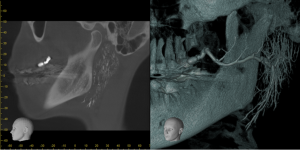
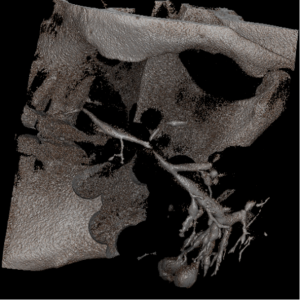
Cone-beam CT (CBCT)
CBCT sialography shares some limitations with conventional sialography, including the need for ductal cannulation, contrast instillation, and exposure to ionising radiation. The strengths are also similar, with CBCT providing high spatial resolution and diagnostic accuracy [6]. Studies have shown the superiority of CBCT in visualising higher-order duct branches and detecting sialolithiasis and stenoses [7 – 10]. Additionally, multiplanar data acquisition enables 3D reconstruction, enhancing diagnostic capabilities (Figures 4 – 5).
Fluoroscopy radiation vs CBCT radiation
To assess a potential advantage of CBCT, we compared the radiation dose of CBCT sialograms with fluoroscopic sialograms. A retrospective review of diagnostic fluoroscopic sialograms performed at St. George's Hospital between September 2016 and September 2024 was conducted. Dose data was retrieved, analysed, and compared with prior data on dose rates for standardised CBCT examinations [11].
The average radiation dose for fluoroscopic sialography was 1679 mGy·cm², compared with 1310 mGy·cm² for CBCT, representing a 24.69% dose reduction with CBCT.
Magnetic resonance imaging (MRI)
A key advantage of MRI is the absence of ionising radiation. Additionally, MRI provides excellent soft tissue contrast and does not require ductal cannulation. Fast acquisition heavily T2-weighted sequences can effectively display ductal morphology, and imaging can be further enhanced with sialagogues (Figures 6 – 8).
However, MRI sialography has limited spatial resolution and may not depict third-order ductal branches or small stones as effectively as other methods [12 - 14].
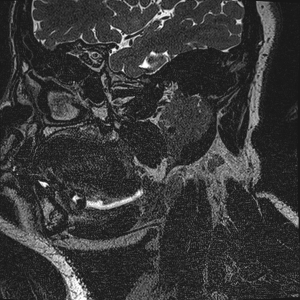
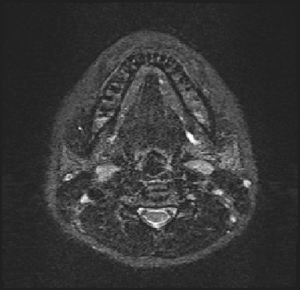
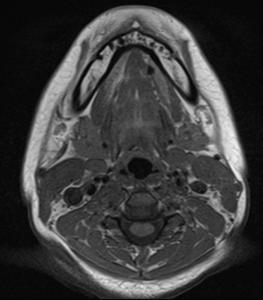
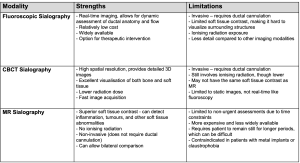
Table 1 summarises the main strengths and limitations across the modalities.
All imaging modalities are susceptible to false positives or artefact related to intraductal gas.