We analyzed data from 60 patients with CLD. The median age was 57.5 years, and 71.7% were male. The distribution of CLD etiology was: Hepatitis B 13.3%, Hepatitis C 10%, ALD 28.3%, MASLD 13.3%, Billiary liver disease 1,7%, acute hepatitis of unclear etiology 5% and other causes 28.3%.
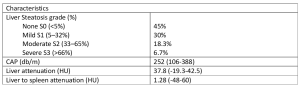
The histological and imaging characteristics of the patients are summarized in Table 1.
The AUROCs with 95% confidence intervals, and optimal cut-offs for the three methods used to predict each steatosis grade (≥S1, ≥S2, S3) are presented in Table 2 and Figure 1.
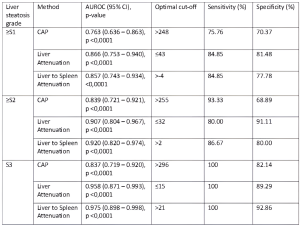
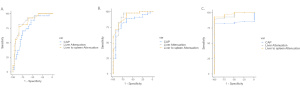
CT outperformed CAP in predicting steatosis grades across all methods However, statistical significance in pairwise comparisons was observed only for severe steatosis (S3), with CAP vs. liver attenuation p = 0.012 and CAP vs. liver-to-spleen attenuation p = 0.004. No significant differences were found between the CT methods in predicting steatosis stages (liver attenuation vs. liver-to-spleen attenuation, p-values: 0.767, 0.722, and 0.189).
The proposed cut-offs for assessing steatosis grades (≥S1, ≥S2, S3) using CT liver attenuation were ≤43, ≤32, and ≤15, while for the difference between liver and spleen attenuation, the cut-offs were >-4, >2, respectively >21.