Congress:
ECR25
Poster Number:
C-27030
Type:
Poster: EPOS Radiologist (scientific)
Authorblock:
Y. Yang, H. Huang, Z. Wen; Beijing/CN
Disclosures:
Yuming Yang:
Nothing to disclose
Hao Huang:
Nothing to disclose
Zhiyong Wen:
Nothing to disclose
Keywords:
Genital / Reproductive system male, Oncology, Pelvis, MR, Computer Applications-Detection, diagnosis, Diagnostic procedure, Cancer, Neoplasia
Of the 193 patients included in total , CsPCa was detected in 64 patients (33.4%), and the other 129 patients were diagnosed with non-significant cancers or no malignant lesions. Logistic regression analysis demonstrated that f/tPSA, PSAD, bpMRI scores and mpMRI scores were independent predictors for CsPCa (P < 0.05).
The bpMRI nomogram was established using f/tPSA, PSAD and bpMRI scores.
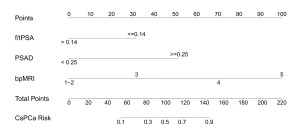
Fig 1: Nomogram for predicting clinically significant prostate cancer based on f/tPSA, PSAD and bpMRI scores.
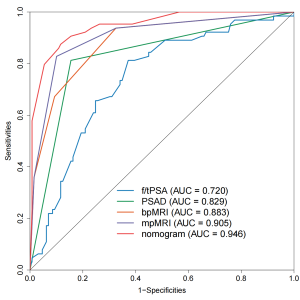
Fig 2: Comparison of ROC curves for predicting clinically significant prostate cancer.
The model showed satisfying calibration on internal bootstrap validation (corrected C-index = 0.938). The calibration curves showed a great agreement between the apparent curve and the ideal curve. The Hosmer-Lemeshow test produced a non-significant result (P > 0.05), which supports the goodness-of-fit of the model.

Fig 3: Calibration curves of the nomogram, including f/tPSA, PSAD and bpMRI scores.