We retrospectively analyzed 790 women aged 50–69 years who underwent breast cancer screening using digital breast tomosynthesis (DBT) and 2D synthetic views, between January to February 2023.
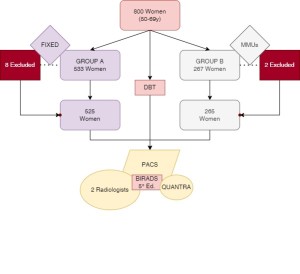
- Group A: 525 women screened at fixed units equipped with Hologic Selenia Dimensions Mammographs.
- Group B: 265 women screened at MMUs equipped with IMS Giotto Class Mammographs.
Data collection focused on:
- Recall rates: The proportion of screenings requiring additional evaluation due to abnormalities.
- Detection rates: The percentage of screen-detected breast cancer cases among total screenings.
- Positive predictive values (PPVs): Evaluations of recall and biopsy effectiveness in identifying cancers.
- Tumor characteristics such as histologic grade, size, lymph node involvement, and receptor status.
- Refusal rates for follow-up assessments: An indicator of adherence and acceptance.
Both groups underwent imaging with double projections (medio-lateral-oblique and cranio-caudal), and data were recorded in the Caserta Local Health Authority's database. Double-reading of the images was conducted by a centralized team of radiologists to ensure consistency. Breast density was assessed using the Quantra software, categorized according to BI-RADS (5th Edition), and subdivided into non-dense (A and B) or dense (C and D).
Statistical analyses included:
- Shapiro-Wilk and Kolmogorov-Smirnov tests for age distribution normality.
- Fisher’s exact test and Chi-square test for group comparisons.
- Spearman’s correlation to evaluate relationships between age and breast density.
Data visualization utilized boxplots, kernel density estimates, and frequency histograms. A p value < 0.05 was considered significant.