Findings and procedure details
Low-Dose CT (LDCT)
LDCT has demonstrated a significant reduction in radiation exposure and energy consumption, with reported decreases of up to 40%. Studies confirm that LDCT achieves comparable sensitivity and specificity to standard-dose CT in detecting and characterizing CRLM [14]. Additionally, iterative reconstruction techniques have improved lesion detection, even in low-dose settings.
Fig 7: The images show (A) standard-dose arterial phase image created with model-based iterative reconstruction (MBIR), (B) standard-dose portal venous phase image created with MBIR, (C) low-dose arterial phase image reconstructed by deep learning–based denoising (DLD), and (D) low-dose portal venous phase image reconstructed by DLD. Originally published by Lee DH, Lee JM, Lee CH, Afat S, Othman A. Image Quality and Diagnostic Performance of Low-Dose Liver CT with Deep Learning Reconstruction versus Standard-Dose CT. Radiol Artif Intell. 2024 Mar;6(2):e230192. doi: 10.1148/ryai.230192. PMID: 38231025; PMCID: PMC10982822.
Fig 8: Images from a 48-year-old male who underwent anterior resection for sigmoid colon cancer. Contrast-enhanced CT scans reveal a 9-mm, peripherally enhancing, low-attenuation nodular lesion in segment IV of the liver (arrow). Surgical resection confirmed the lesion as a metastasis from colon cancer through histopathologic analysis. (A) Standard-dose arterial phase image reconstructed using model-based iterative reconstruction (MBIR), (B) standard-dose portal venous phase image reconstructed with MBIR, (C) low-dose arterial phase image processed with deep learning–based denoising (DLD), and (D) low-dose portal venous phase image processed with DLD. Originally published by Lee DH, Lee JM, Lee CH, Afat S, Othman A. Image Quality and Diagnostic Performance of Low-Dose Liver CT with Deep Learning Reconstruction versus Standard-Dose CT. Radiol Artif Intell. 2024 Mar;6(2):e230192. doi: 10.1148/ryai.230192. PMID: 38231025; PMCID: PMC10982822.
Fig 9: The overall image quality of abdominal CT scans (window level: 60 HU; window width: 360 HU) for a 63-year-old woman with colorectal cancer and abdominal metastatic lesions (SSDE: 9.09 mGy; average scan size: 32.2 cm) was assessed. (A) iDose4 level 4 achieved an average image quality score of 2.5; (B) Precise Image, Standard had an average score of 3; (C) Precise Image, Smooth obtained an average score of 4; and (D) Precise Image, Smoother also achieved an average score of 4. Originally published by Greffier, J., Durand, Q., Serrand, C., Sales, R., de Oliveira, F., Beregi, J.-P., Dabli, D., & Frandon, J. (2023). First Results of a New Deep Learning Reconstruction Algorithm on Image Quality and Liver Metastasis Conspicuity for Abdominal Low-Dose CT. Diagnostics, 13(6), 1182. https://doi.org/10.3390/diagnostics13061182.
Fig 10: Lesion conspicuity scores for liver CT images (window level: 90 HU; window width: 190 HU) of a 64-year-old man with colorectal cancer and a 14.1-mm liver metastasis in segment VI (SSDE: 6.73 mGy; average scan size: 28.9 cm) were evaluated. (A) iDose4 level 4 achieved a lesion conspicuity score of 3; (B) Precise Image, Standard also received a score of 3; (C) Precise Image, Smooth achieved a score of 4; and (D) Precise Image, Smoother obtained the highest score of 5. Originally published by Greffier, J., Durand, Q., Serrand, C., Sales, R., de Oliveira, F., Beregi, J.-P., Dabli, D., & Frandon, J. (2023). First Results of a New Deep Learning Reconstruction Algorithm on Image Quality and Liver Metastasis Conspicuity for Abdominal Low-Dose CT. Diagnostics, 13(6), 1182. https://doi.org/10.3390/diagnostics13061182.
Fig 11: Lesion conspicuity scores for liver CT images (window level: 90 HU; window width: 190 HU) of a 64-year-old man with colorectal cancer and a 2.70-mm liver metastasis in segment VIII (SSDE: 10.24 mGy; average scan size: 34.6 cm) were assessed. (A) iDose4 level 4 received a lesion conspicuity score of 3; (B) Precise Image, Standard also scored 3; (C) Precise Image, Smooth achieved a score of 4; and (D) Precise Image, Smoother obtained the highest score of 5. Originally published by Greffier, J., Durand, Q., Serrand, C., Sales, R., de Oliveira, F., Beregi, J.-P., Dabli, D., & Frandon, J. (2023). First Results of a New Deep Learning Reconstruction Algorithm on Image Quality and Liver Metastasis Conspicuity for Abdominal Low-Dose CT. Diagnostics, 13(6), 1182. https://doi.org/10.3390/diagnostics13061182.
Fig 12: Axial CT images of a 54-year-old woman displaying liver metastases larger than 10 mm, 6–10 mm, and 5 mm or smaller, reconstructed using ASiR-V 50% (A, B, and C, respectively) and DLIR_M (D, E, and F). ASiR-V refers to a hybrid iterative reconstruction algorithm, while DLIR denotes a deep learning image reconstruction algorithm. Originally published by Caruso, D., De Santis, D., Del Gaudio, A. et al. Low-dose liver CT: image quality and diagnostic accuracy of deep learning image reconstruction algorithm. Eur Radiol 34, 2384–2393 (2024). https://doi.org/10.1007/s00330-023-10171-8.
Accelerated MRI Protocols
Fast MRI protocols have reduced scan times by approximately 30%, translating to lower energy demands and improved patient throughput. Despite the reduced acquisition times, diagnostic accuracy for liver metastases remains uncompromised. Moreover, accelerated MRI has been shown to enhance patient comfort, as shorter scans reduce motion artifacts and improve compliance.[10,11]
Table 2: MRI (T1-Weighted Post-Contrast) parameters of the liver protocols for baseline and the energy-saving modes: economic and Deep Learning (DL).
Table 3: MRI (DWI) parameters of the liver protocols for baseline and the energy-saving modes: economic and Deep Learning (DL).
Table 4: MRCP parameters for baseline and the energy-saving modes: economic and Deep Learning (DL).
Fig 13: A 50 year-old woman with colorectal liver metastases. Standard (left) vs accelerated (right) DWI demonstrating faster acquisition (3:37 vs 2:46 mins) and improved quality using the accelerated protocol. Originally published by Chan WY, Hartono S, Thng CH, Koh DM. New Advances in Magnetic Resonance Techniques in Abdomen and Pelvis. Magn Reson Imaging Clin N Am. 2020 Aug;28(3):433-445. doi: 10.1016/j.mric.2020.04.001. Epub 2020 Jun 3. PMID: 32624160.
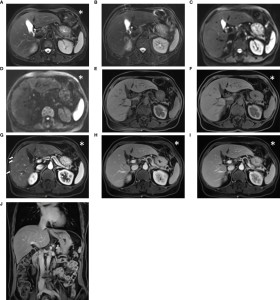
Fig 14: Images acquired using the conventional liver imaging protocol from a 52-year-old post-surgical colon cancer patient: The lesion was not detectable on the T2-weighted BLADE image (A), T2-weighted TSE image (B), diffusion-weighted images with b-values of 50 and 1000 s/mm² (C, D), pre-contrast T1-weighted Fat-Sat VIBE image (E), or water images from DIXON VIBE (F). However, in the arterial-phase T1-weighted VIBE image (G), multiple small hypervascular focal lesions were visible in the right lobe. These suspicious lesions returned to isointensity in the venous-phase (H) and delayed-phase images (I, J). While the conventional protocol’s diagnostic report classified these findings as transient hepatic intensity differences, the abbreviated protocol did not mention these lesions. The abbreviated protocol included the acquisition marked with an asterisk (*), while the conventional protocol comprised all series. Notably, the transient hepatic intensity differences were subtle and challenging to detect. Originally published by Li J, Ma C, Chen Y, Fu C, Wang X, Kuehn B, Yang Q, Lu J. The Feasibility of a Fast Liver MRI Protocol for Lesion Detection of Adults at 3.0-T. Front Oncol. 2021 Aug 4;11:586343. doi: 10.3389/fonc.2021.586343. PMID: 34422623; PMCID: PMC8371706.
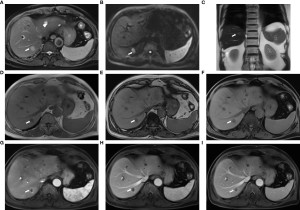
Fig 15: Images obtained using the fast liver imaging protocol from a 74-year-old male patient with liver metastases originating from colon cancer: (A) T2-weighted BLADE; (B) diffusion-weighted imaging (DWI) with b-value of 1000 s/mm²; (C) T2-HASTE; (D, E) in-phase and out-of-phase DIXON VIBE; (F) water images from DIXON VIBE; (G–I) contrast-enhanced T1-weighted VIBE images showing arterial (G), venous (H), and delayed (I) phases. The liver metastasis (arrow) in segment VII exhibits slightly increased signal intensity on both the T2 BLADE and T2 HASTE images, while hepatic cysts [arrowhead in (A)] located in segments II and IV display high signal intensity on the T2 BLADE. The metastasis appears hyperintense on DWI and hypointense on T1-weighted imaging. In the contrast-enhanced MRI, annular enhancement of the metastasis is noted, distinguishing it from the surrounding liver parenchyma. Originally published by Li J, Ma C, Chen Y, Fu C, Wang X, Kuehn B, Yang Q, Lu J. The Feasibility of a Fast Liver MRI Protocol for Lesion Detection of Adults at 3.0-T. Front Oncol. 2021 Aug 4;11:586343. doi: 10.3389/fonc.2021.586343. PMID: 34422623; PMCID: PMC8371706.
Contrast-Enhanced Ultrasound (CEUS)
CEUS has emerged as a viable alternative in specific clinical scenarios, particularly for patients who cannot undergo contrast-enhanced CT or MRI due to contraindications. Studies report that CEUS achieves diagnostic sensitivity and specificity comparable to CT and MRI for detecting CRLM, with the added benefit of zero radiation exposure [13]. Its portability and cost-effectiveness further enhance its utility in resource-limited settings.
Fig 16: 59 years old woman with colon cancer presents multiple hypo-and hyperechoic masses in the liver. Originally published by EFSUMB https://efsumb.org/portfolio-item/liver-metastases/.
Fig 17: The figure shows a typical liver metastasis in the B-scan as well as the corresponding contrast behaviour in the late phase after 4 min in contrast-enhanced ultrasound (CEUS). Originally published by Schweizer, M., Schmidberger, J., Schlingeloff, P. et al. Contrast-enhanced ultrasound (CEUS) in patients with metastasis-like hepatic alveolar echinococcosis: a cohort study. J Ultrasound 26, 129–136 (2023). https://doi.org/10.1007/s40477-022-00688-x.
Fig 18: The same hypovascular liver metastasis is visualized by US and CEUS in both the arterial and portal phases. In the arterial phase a slight rim enhancement is seen (arrows). The non-enhancing area in the center represents a necrosis, and is demonstrated in both the arterial and late phases. (A) B-mode US; (B) Arterial phase; (C) Late phase. Originally published by Larsen LPS. Role of contrast enhanced ultrasonography in the assessment of hepatic metastases: A review. World J Hepatol 2010; 2(1): 8-15 [PMID: 21160951 DOI: 10.4254/wjh.v2.i1.8].
Fig 19: (A) Fusion imaging combining contrast-enhanced ultrasound (CEUS) on the left and contrast-enhanced CT (CE-CT) on the right during the portal venous phase. It highlights the detection of a malignant liver lesion (colorectal liver metastasis) located at the margin of the left liver lobe prior to surgery. (B) Intraoperative CEUS using a multifrequency linear probe shows washout of the contrast agent from the malignant lesion during the late phase (after 3 minutes). (C) Additional small tumor lesions, measuring 4–5 mm, were detected during surgery using CEUS with the same multifrequency probe. Originally published by Loss M, Schneider J, Uller W, Wiggermann P, Scherer MN, Jung W, Schlitt HJ, Stroszczynski C, Jung EM. Intraoperative high resolution linear contrast enhanced ultrasound (IOUS) for detection of microvascularization of malignant liver lesions before surgery or radiofrequeny ablation. Clin Hemorheol Microcirc. 2012;50(1-2):65-77. doi: 10.3233/CH-2011-1444. PMID: 22538536.
Fig 20: Liver metastases – CEUS examination: (A) Standard ultrasound – globally inhomogeneous liver structure, with multiple, small hypoechoic nodules; (B) Portal-venous phase – multiple hypoenhancing nodules; (C, D) Late phase – hypoenhancing small nodules. Originally published by Sporea I, Badea R, Martie A, Sirli R, Socaciu M, Popescu A, Dănilă M. Contrast enhanced ultrasound for the characterization of focal liver lesions. Med Ultrason. 2011 Mar;13(1):38-44. PMID: 21390342.
Fig 21: A 37-year-old woman diagnosed with colon cancer. (A) Ultrasound revealed a 7 mm hyperechoic lesion (arrow) in segment VII of the liver. (B) Color Doppler imaging showed no significant blood flow within the lesion (arrow). Following baseline ultrasound assessment, distinguishing between metastasis and hemangioma was challenging. (C) Using a high-frequency linear probe, the lesion (arrow) exhibited rim-like hyper-enhancement during the arterial phase (15 seconds). (D) In the portal venous phase (108 seconds), the lesion (arrow) showed washout, appearing as hypo-enhancement. The imaging findings on contrast-enhanced ultrasound (CEUS) were characteristic of CRLM. Originally published by Qin, Si and Guang-Jian Liu. “Ultrasound Examination in Detection and Characterization of Colorectal Liver Metastases.” (2015).
Fig 22: A 51-year-old woman with colon cancer undergoing chemotherapy. (A) Ultrasound revealed an inhomogeneous liver parenchyma, with the lesion (indicated by an arrow) not clearly visible. (B) During the arterial phase (14 seconds), the lesion (arrow) displayed homogeneous hyper-enhancement. (C) In the late phase (120 seconds), the lesion (arrow) showed washout, appearing as hypo-enhancement. The lesion was effectively identified and characterised using contrast-enhanced ultrasound (CEUS). Originally published by Qin, Si and Guang-Jian Liu. “Ultrasound Examination in Detection and Characterization of Colorectal Liver Metastases.” (2015).
Fig 23: A 38-year-old man with rectal cancer following chemotherapy. (A) Ultrasound identified a hypoechoic lesion (arrow) in segment IV of the liver, measuring 16 mm in diameter. (B) During the arterial phase (25 seconds), the lesion (arrow) displayed hypo-enhancement. (C) In the portal venous phase (55 seconds), the lesion (arrow) remained hypo-enhanced. The findings on contrast-enhanced ultrasound (CEUS) indicated that chemotherapy significantly reduced the lesion's blood supply. Originally published by Qin, Si and Guang-Jian Liu. “Ultrasound Examination in Detection and Characterization of Colorectal Liver Metastases.” (2015).
Cumulative Impact
The combined adoption of these energy-efficient imaging modalities has the potential to reduce overall energy consumption in CRLM imaging by 35-50%. This translates to substantial cost savings for healthcare facilities and aligns radiology practices with global efforts to combat climate change. The adoption of energy-efficient imaging modalities extends beyond CRLM management. These innovations have the potential to transform radiology as a whole, setting new benchmarks for sustainable healthcare practices.
Fig 24: Image created by I. Morawska using Image Creator via Copilot App.
Fig 25: Image created by I. Morawska using Image Creator via Copilot App.
Fig 26: Image created by I. Morawska using Image Creator via Copilot App.


