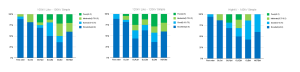
In terms of repeatability, as the energy of the reconstruction increased, the percentage of features with excellent ICC also increased, ranging from 80% to 95% of the analyzed features meeting this criterion. The results are shown in Figure 4.
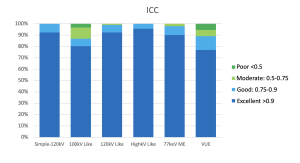
When comparing kV-Like reconstructions, it can be observed that as the simulated kilovoltage increases, the number of features with excellent ICC also increases. It should be noted that the High kV reconstruction generates the image using only the data collected from the tube operating at 140 kV during fast kV switching.
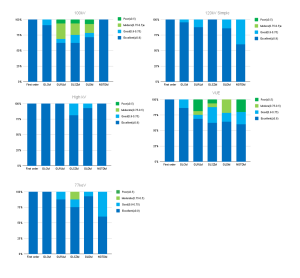
When analyzed by feature families, as shown in Figure 5, first-order features achieved an excellent ICC in 100% of cases across all conducted studies. The GLCM group (Gray Level Co-occurrence Matrix) showed the second-best performance, with an excellent ICC in 86.3% to 100% of features, while the remaining features in this group exhibited a good ICC.
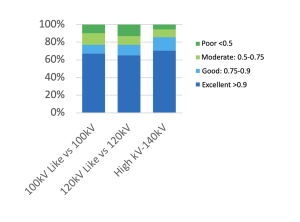
Next, we aim to analyze the reproducibility of radiomic features by comparing a single-energy acquisition with a kV-Like reconstruction. A priori, the data would be expected to be highly similar, as the kV-Like reconstruction simulates, based on dual-energy information, an image comparable to that obtained from a single-energy tube. As shown in Figure 6, the behavior is very similar when comparing 100 kV and 120 kV, with a difference of ≤3% across all feature categories.
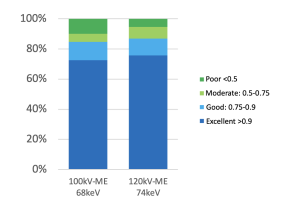
Since the manufacturer specifies the equivalence between monoenergetic images (ME) at 68 keV and 74 keV with those obtained using a single-energy tube at 100 kV and 120 kV, respectively, their impact on radiomic features was analyzed. As shown in Figure 8, more than 70% of the features exhibit excellent concordance in both comparisons. Although the results are similar for both energy levels, the comparison between 120 kV and ME 74 keV shows fewer features with poor concordance.
Finally, to identify the most robust features, those with an ICC greater than 0.9 across all comparisons were selected. Additionally, a coefficient of variation lower than 10% was included as a criterion. As a result, the images shown in Figure 9 were obtained.