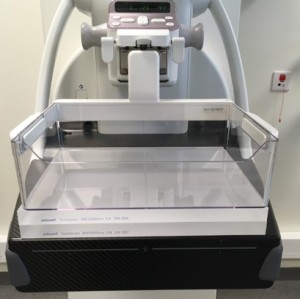
Daily QC is performed using a 40 mm plexiglass block covered the detector area (Figure 1).
The unprocessed image is automatically analyzed by DOSESTAT QC software, which examines exposure parameters, mean pixel value (MV), signal-to-noise ratio (SNR), and standard deviation (SD). The results and feedback appear in the user interface almost immediately. All data preserved on the medical physicist interface.
For the analysis, the software divides the image into five sections: Top-Left, Top-Right, Bottom-Left, Bottom-Right, and the Breast area which covers the most essential part of automatic exposure control (AEC). The Breast area section presents separately (Figure 2).

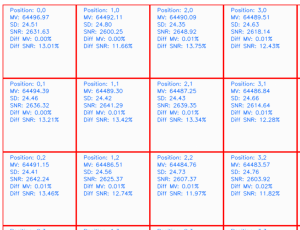
Each region of interest (ROI) of approximately 1 cm² has a fixed position. The software identifies each pixel value and calculates the ROI's mean MV, SD, SNR, and percentage deviations from its own section for MV (Diff MV) and SNR (Diff SNR). See Figure 3.
Key Improvements
Image Analysis
The image analysis was enhanced by implementing fixed ROI positions and comparing individual pixel values to the mean ROI value. This approach allows for more precise detection of pixel errors and deviations.
SNR was previously found to vary greatly between the breast area and the area outside the nipple due to heel effect and lag or ghosting from previous screening images. Dividing the image analysis into sections improved trend analysis and baseline setting.
Visualization
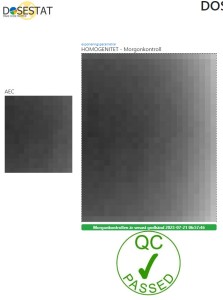
The SNR visualization on user interface was redesigned using a grayscale characterization that turns out to be specific to each mammography equipment. High SNR values are displayed in dark gray, while low SNR values appear in light gray (Figure 4). This new visualization replaces the previous homogeneous image display.
The user interface now features an interactive element, allowing users to click on the image and view separate sections of small ROIs with calculated values. If one or more ROI turn pink, which indicated strongly deviating pixels or dead pixels. Red dots in the ROI show the exact location of possible dead pixels.
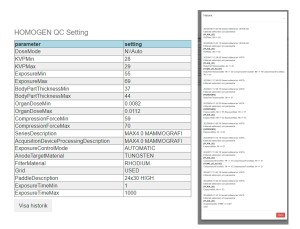
Exposure Parameter Tuning
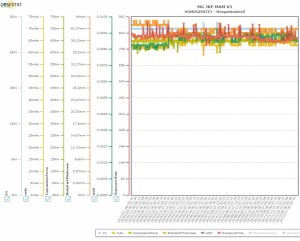
Improvements on the medical physicist interface have been made to exposure parameter tuning traceability by displaying the history of changed tolerances (Figure 5 ). This feature enhances the ability to track and analyze equipment performance over time (Figure 6).