A total of 30 patients with esophageal cancer who received concurrent chemoradiotherapy (CCRT) at our institution between March 2021 and October 2023 were selected as the study population.

The total prescribed dose was 50 Gy, delivered in 25 fractions using 10 MV energy, ensuring that at least 98% of the Planning Target Volume (PTV) received the prescribed dose. The maximum dose (Dmax) was kept below 108% of the prescribed dose. Critical normal tissues, including both lungs, the heart, and the spinal cord, were designated as organs at risk, and conditions were applied to minimize the dose to these normal tissues.
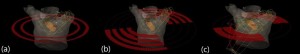
all treatment plans utilizing VitalBeam, the collimator angles for the clockwise (CW) rotating arcs were set at 30°, while the counterclockwise (CCW) rotating arcs had a collimator angle of 330°. Full Arc VMAT (fVMAT) used two Full Arcs with a 360° rotation, whereas Partial Arc VMAT (pVMAT) used four arcs, each with a 360° rotation. For all arcs, avoidance sectors were defined within the ranges of 230°–310° and 50°–130°. Non-Coplanar VMAT (ncVMAT) incorporated two 360° arcs with avoidance sectors, similar to pVMAT, as well as two non-coplanar arcs with rotation angles of 330°–30° and 30°–330°, using a couch angle of 90°, to establish the treatment plan.
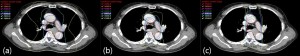
The treatment plans for fVMAT, pVMAT, and ncVMAT were compared using Dose-Volume Histograms (DVH). For the Planning Target Volume (PTV), the evaluation included the target volume covered by 95% of the prescribed dose (V95%), the Homogeneity Index (HI), and the Conformity Index (CI). For the surrounding organs at risk (OARs), including both lungs, the heart, and the spinal cord, the following evaluations were made: for the lungs, the mean dose (Gy), V5Gy (%), V10Gy (%), V20Gy (%), and V30Gy (%); for the heart, the mean dose (Gy), V20Gy (%), and V30Gy (%); and for the spinal cord, the maximum dose (Gy). Additionally, to assess the efficiency of the treatment plans, the total monitor units (MU) were compared.