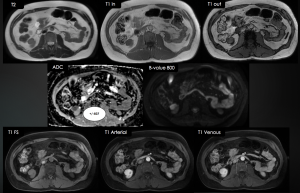
When compared with a CT scan, a renal multiparametric MRI is capable of characterising microscopic fat, as well as the cellularity of the tumour and it is possible to acquire multiple dynamic postcontrast phases without the need for higher radiation exposure.[5]
Several characteristics can be assessed:
- T2W Signal Intensity (SI)
- T1W SI
- Presence of Microscopic/Macroscopic Fat
- DWI and ADC value
- Homogeneity and Heterogeneity
- Presence/absence of necrosis
- Presence/absence of central scar
- Lesion Borders
- Enhancement pattern
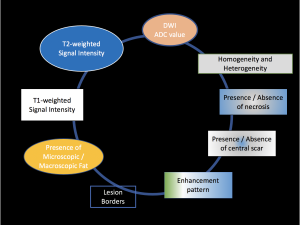
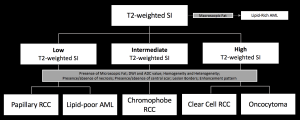
The following flow chart and table were constructed based on different key proprieties found in the literature, starting with the predominant one, the T2W SI (non-fat suppression sequence).
Clear Cell RCC
Clear cell RCC is the most prevalent subtype of RCC.[8] In 95% of cases, it is sporadic; the remaining 5% are associated with hereditary syndromes including von Hippel–Lindau disease and tuberous sclerosis.[9] Clear cell carcinomas are associated with a worse prognosis.[8] Also, these tumours originate from the proximal nephron.[9]
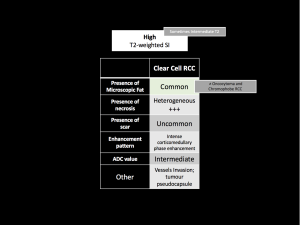
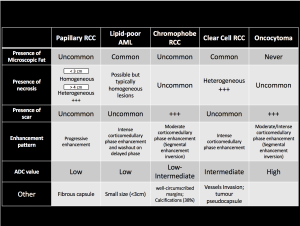
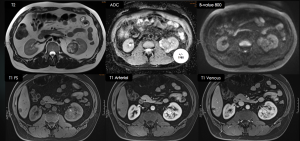
Clear cell RCC is characterised by T2-hyperintense, with some cases displaying intermediate T2.[5] The primary differential diagnoses are oncocytomas and chromophobe RCC.[4] The presence of microscopic fat should be evaluated, as it is rarely or never present in the differential diagnosis. Additionally, the lesions are typically heterogeneous with central necrosis.[5] Clear cell RCCs demonstrate a tendency to invade vessels and a tumour pseudocapsule (or hypointense rim) may be observed on both T1W/T2W images.[9] The ADC values of clear cell RCC exhibit significant variability and often overlap with the differentials.[10]
Papillary RCC
Papillary RCC represents the second most common subtype of RCC. It manifests bilaterally in 4% of cases and multifocally in 23%. Papillary carcinomas are generally associated with a more favourable prognosis. These tumours originate from the distal nephron.[9]
It is important to note that small papillary RCCs are typically homogeneous, and up to 25% of cases will not enhance on contrast-enhanced CT. This highlights the importance of multiparametric MRI in the diagnosis of these tumours.[2]
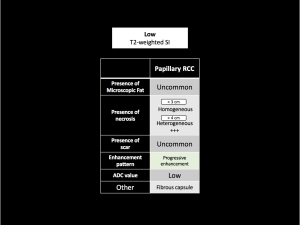
Papillary RCC typically exhibits T2W hypointensity and progressive enhancement on post-contrast images. Also, papillary RCC typically markedly restricts diffusion, a feature that can help identify an atypical T2W isointense papillary RCC.[5]
In tumours measuring less than 3cm, MRI typically reveals a well-circumscribed, homogeneous, peripherally located tumour. However, when tumours exceed 4cm, internal heterogeneity may be observed due to the presence of haemorrhage, calcification and necrosis.[9]
Chromophobe RCC
Chromophobe RCCs represent the third most prevalent subtype. These tumours have a more favourable prognosis in comparison with clear cell RCCs and a larger mean tumour size (7.2cm). It originates from the distal nephron.[9]
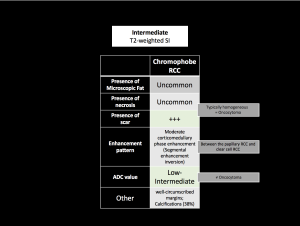
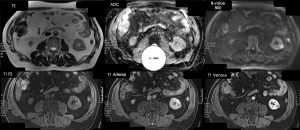
Although the chromophobe RCC is usually isointense, it can have variable T2W SI and be hyperintense. Frequently homogeneous and may show a central stellate scar. It shows a moderate corticomedullary phase enhancement (between the papillary RCC and clear cell RCC) and a well-circumscribed margin.[5;9] Segmental enhancement inversion is a nonspecific feature that has been described as areas that exhibit marked enhancement following the administration of contrast material in early phase images, but enhancement is less pronounced in more delayed images whereas other areas that appear hypovascular on early phase images demonstrate progressive enhancement in more delayed images.[9] The ADC values of chromophobe RCC are usually low and can be used to differentiate from an oncocytoma.[4;10]
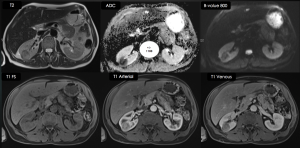
Oncocytoma
Oncocytoma has the same origin as chromophobe RCC, and there is an overlap in the histologic and imaging features of the two conditions. A core biopsy may not be sufficient to differentiate between the two.[9]
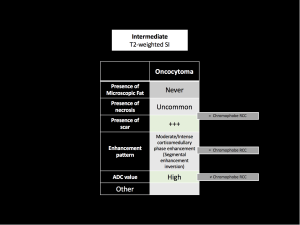
Similar to chromophobe RCC, oncocytomas can exhibit variable T2W SI, ranging from hyperintense to isointense. They demonstrate a moderate to avid corticomedullary phase enhancement or may also present with segmental enhancement inversion.[5] Oncocytomas typically exhibit higher ADC values than Chromophobe RCC.[4;10]
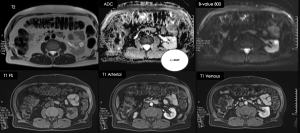
Lipid Poor Angiomyolipoma
The majority of cases occur in the 4th–6th decades, with a higher prevalence observed in women. Lipid-poor AMLs constitute 5% of all AMLs and are generally reported to be diminutive in size, with an average diameter of 3cm. These neoplasms are predominantly composed of smooth muscle and disorganised vascular components.[9]
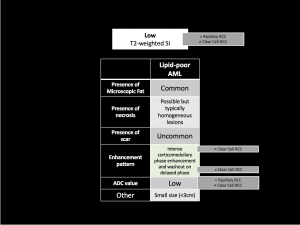
Lipid-poor AMLs present with homogeneously low T2W SI due to the abundance of smooth muscle (resembling papillary RCCs and contrasting with clear cell RCCs), however they exhibit intense enhancing characteristics at the corticomedullary phase (distinct from papillary RCCs and similar to clear cell RCCs). Two other imaging features have been identified as useful in suggesting a diagnosis of lipid-poor AMLs: these are high restriction diffusion (similar to papillary RCCs and distinct from clear cell RCCs) and an elevated arterial-to-delayed enhancement ratio (more specific). Morphological characteristics may offer additional information, such as the "ice cream cone" pattern.[4;5]
What does the urologist expect from the radiologist's report in staging?
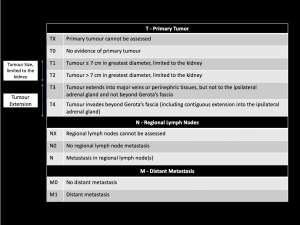
Imaging is of paramount importance in the staging of RCC. The Tumour-Node-Metastasis (TNM) classification system of RCC should be the foundation for the radiology report.[11]
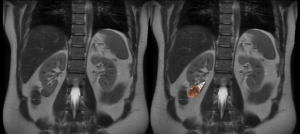
It is imperative to pay close attention to the upper limit of the inferior vena cava neoplastic thrombus, as this is pivotal in determining the complexity of the surgery, particularly in cases where it reaches the level of the diaphragm and heart.[2]
To evaluate the feasibility of partial nephrectomy, the RENAL nephrometry score should also be included in the report, which assigns a score to the tumour depending on points gathered from the Radius of the tumour, the Exophytic/endophytic nature, the Nearness to the collecting system or sinus, the Anterior/posterior descriptor, and the Location relative to the polar line.[12]