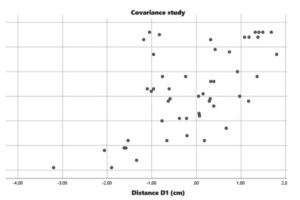
The results of the covariance analysis among the variables under investigation, focusing on the relationship between the independent variable, the D1 distance, and the dependent variable, the mean dose to the heart, are presented below.

The validation of initial assumptions involved analyzing linearity between variables, confirmed by the Pearson correlation coefficient (P = 0.618, sig. 0.000). Additionally, residual standardization was performed.Regarding the autocorrelation of residuals, the parallel analysis of the Durbin-Watson test and residual plots indicated its absence. The acceptance region for the Durbin-Watson test (AR = [1.41;2.41]) was satisfied, reinforcing the lack of autocorrelation.
After validating the assumptions, we proceeded to estimate the parameters of the Simple Linear Regression Model (SLRM) using the Least Squares Method. The resulting equation, presented in the figure, reveals a slope of the line (coefficient of the independent variable) of 4.330 and a constant indicating that, for a mean dose to the heart of 0.930%, the D1 distance is 0 cm. Both coefficients are statistically significant (t-test, sigma 0.000).
Statistical validation of the model was performed through the ANOVA test, indicating the significance of the SLRM in explaining the variables under study. This provides a comprehensive view of the obtained results, consolidating the relationship between D1 distance and the mean dose to the heart and validating the effectiveness of the SLRM in explaining the phenomenon under study.
After analyzing the variables and verifying the assumptions for creating the SLRM, we determined the equation that defines the model: Mean Dose (%) = 4.330 + 0.930 × D1. This equation represents the linear relationship between D1 distance and the mean dose to the heart, providing a robust statistical model for predicting the mean dose to the heart based on the defined D1 distance.