This two-stage single-center study included a prospective development dataset consisting of consecutive participants with rectal cancer who underwent pretreatment MRI and direct total mesorectal excision (TME) from December 2021 to January 2023 and a retrospective validation cohort of consecutive patients with locally advanced rectal cancer who had available pretreatment MRI and underwent TME after neoadjuvant therapy (NAT) from December 2019 to July 2020. Informed consent was obtained from participants in the development dataset and the requirement for it was waived for patients in the validation cohort.
- Imaging Analyses for the Development Dataset
Image acquisition was performed with 1.5-T or 3.0-T MRI units and the protocol consisted of sagittal, axial, coronal, oblique axial T2-weighted imaging, axial diffusion-weighted imaging (DWI), and opposed-phase axial T1-weighted imaging. All nodes with a short-axis diameter ≥ 3 mm in the mesorectum or around the superior rectal artery were identified as candidate nodes and evaluated by multiple characteristics potentially associated with ENE from three aspects (i.e., interior, margin, and surroundings).
Fig 1: Table 1: MRI evaluation of nodal characteristics
Note.—SAD = short-axis diameter, LAD = long-axis diameter, CSE = chemical shift effect, DWI = diffusion-weighted imaging, T2WI = T2-weighted imaging, T1WI = T1-weighted imaging.
Fig 2: Figure 1: Representative images illustrating patterns of the internal structure (A-C) , nodal border (D-F), and chemical shift effect (CSE) (G-J) on axial T2-weighted imaging. The nodal internal structure is shown as (A) homogeneous and (B-C) heterogeneous, the nodal border is shown as (D) well defined, which is regular and smooth, (E) shaggy, and (F) spiculate, and the latter two are both classified as poorly defined, and the CSE, the black or bright outlines at the edge of the node (black arrows), is shown as (G) uniform, (H) irregular, (I) interrupted, and (J) absent, and the latter three are all classified as nonuniform.
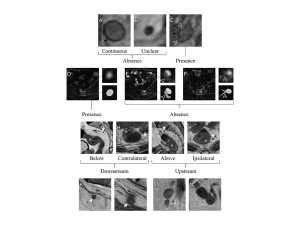
Fig 3: Figure 2: Representative images illustrating patterns of the broken-ring sign (A-C), tail sign (D-F), relative location (G-J), interruption of vessels (K, L), and fusion (M, N). The broken-ring sign is shown in (A-C) on opposed-phase axial T1-weighted imaging as A) continuous, where the sharp black circle enveloping the node is complete and continuous; (B) unclear, where the circle cannot be clearly depicted; and (C) present, where the sharp black circle enveloping the node is interrupted or incomplete, and the first two are both classified as an absence of the broken-ring sign (black arrows: the sharp black circle enveloping the node, arrowheads: the interruption of the circle). In (D-F), diffusion-weighted imaging (DWI) with b = 0 and the corresponding diagram show (D) an isolated, sharply defined high signal node with no other high signal around it, which is regarded as an absence of the tail sign, and (E) and (F) a band-like or linear high signal intensity directly attached to the node (arrowhead) and the nodal margin is poorly defined at the intersection. Both (E) and (F) are classified as the presence of the tail sign. In (G-J), relative location on multiplanar T2-weighted imaging, (G) shows the node locates below the distal edge of the tumor, (H) shows the node locates at the tumor height but beyond the clock position of tumor invasion, (I) shows the node locates above the proximal edge of the tumor, and (J) shows the node locates at the tumor height and within the clock position of tumor invasion. The first two are classified as downstream while the latter two are classified as upstream (*: tumor, white arrows: the node). In (K) and (L), the interruption of vessels on sagittal T2-weighted imaging is shown as being (K) absent, the node goes alongside vessels but can be separate from vessels, and (L) present, the node directly interrupts the course of vessels but cannot be separated from the vessel and partially or fully overlaps with the course of vessels, respectively (white arrows: the node, dashed lines: the course of vessels). The absence and presence of fusion are shown in (M) and (N), namely, a clear boundary or no visible boundary between adjacent nodes.
Specifically, as the direct reflection of the lymph node capsule, the nodal margin was assessed by two existing nodal status-related characteristics, i.e. the border and CSE, and two novel potential signs for ENE as follows. The presence of broken-ring sign refers to the interruption of the sharp black circle that envelopes the entire node in axial opposed-phase T1-weighted imaging. The presence of tail sign is defined as the existence of any band-like or linear high signal intensity that is directly attached to the node in axial DWI with b = 0 and the nodal margin where the surrounding high signal intersects with the node is poorly defined.
- Node-by-Node Matching and Pathological Evaluation for the Development Dataset
All candidate nodes were localized in three directions based on the preoperative T2-weighted imaging according to the primary tumor location and a 3D node map consisting of all candidate nodes was established for every participant and was used to achieve node-by-node matching between MRI and pathology.
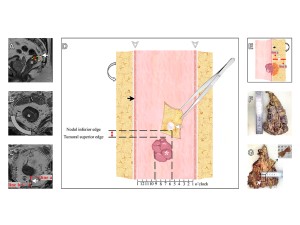
Fig 4: Figure 3: An example of node-by-node matching between radiological and pathological evaluation in a 79-year-old male with rectal cancer. (A) Sagittal T2-weighted imaging shows the candidate node (white arrow) is located above the tumor (*), and the node-tumor shortest distance (red line) is measured by the distance of the tangents of the nodal inferior edge (yellow dashed line) and the tumoral superior edge (yellow dashed line) along the rectal lumen, which is 0.5 cm. In (B-C), oblique axial and axial T2-weighted imaging show the rectal wall and mesorectum divided clockwise from the center of the rectal lumen with the tumor (*) invading the rectal wall from 6 to 9 o’clock and the candidate node (white arrow) located at 6 o’clock. Additionally, on the (C) axial image the nodal depth in the mesorectum is determined by the vertical distance from the node to the rectal wall (line a) and to the mesorectal fascia (line b), both of which are 0.4 cm. In this way, this candidate node is located 0.5 cm above, 6 o’clock, 0.4 cm to the rectal wall and 0.4 cm to the mesorectal fascia. The corresponding 3D node map is drawn in (D, E). (D) shows the front view of the 3D node map, in which the red double-headed arrow between the nodal inferior edge and the tumoral superior edge indicates the candidate node (white arrow) which is located 0.5 cm above the tumor (*). The arrowheads indicate that the removed specimen is cut open at 1 o’clock in the axial clock position, and thus the whole specimen could be oriented from left to right corresponding to the clock point on axial MRI. The longitudinal dashed lines indicate that the tumor invades from 6 to 9 o’clock and that the candidate node is located at 6 o’clock (black arrow: rectal wall; curved arrow: mesorectal fascia). (E) shows the side view of the 3D node map, line a and b demonstrate the depth of the candidate node (white arrow) in the mesorectum, that is, 0.4 cm to the rectal wall (black arrow) and 0.4 cm to the mesorectal fascia (curved arrow). Using the 3D node map as the bridge, the radiologist and pathologist collaborated to match the candidate node in the specimen. The photographs of the straightened excised rectum and the sliced mesorectum (F, G) show this candidate node (white arrow) located above the proximal edge and at the left edge of the tumor (dashed line) and at the midpoint of the mesorectum, which could be matched with the node map and MRI. Then, the matched node was recorded and then underwent further processing.
- Evaluation for the Validation Cohort
Acquired by the same process as in the prospective dataset, pretreatment MRI was assessed at the patient-level in the validation cohort. In addition to the presence of MRI-detected ENE, clinical information and other radiological risk factors were also evaluated.
Characteristics were compared between pathologic-ENE- and pathologic-ENE+ nodes using the Mann-Whitney U test or χ2 test. Cohen’s kappa was used to assess the interobserver agreement of categorical characteristics and Spearman or Kendall tau-b was used to assess the correlation between variables. A multivariable logistic model was established and converted to a binary predictor with the cutoff value determined by the maximum Youden’s index method. Diagnostic performances were evaluated by receiver operating characteristic (ROC) curve analysis and the areas under the ROC curve (AUCs) were compared by the DeLong method. The sensitivity, specificity, positive predictive value (PPV), negative predictive value (NPV) and accuracy were calculated.
In the validation cohort, 3-year disease-free survival (DFS) was compared using Kaplan-Meier survival curves with the log-rank test. Multivariable Cox proportional hazards regression analyses were used to identify independent prognostic factors for 3-year DFS.

