Accuracy of SALSA
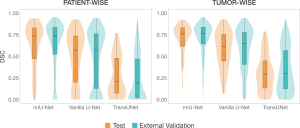
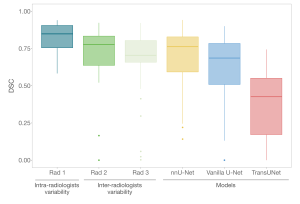
The nnU-Net framework clearly outperformed the other two architectures in segmentation capabilities (Figure 3), making it the representative model for SALSA.
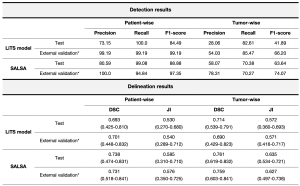
Our proposed model shows high accuracy in liver tumor detection with a patient-wise precision of 99.65%, and a recall of 94.17% for the external validation cohort. When considering each lesion individually, SALSA obtained a lesion-by-lesion detection precision of 81.72% and a recall of 57.92% in the same dataset (Figure 4, Table 2).

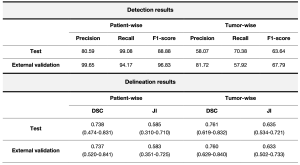
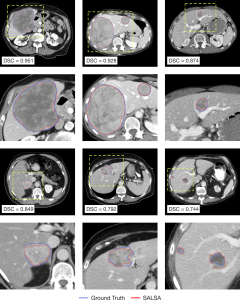
In parallel, the tumor masks automatically generated by SALSA exhibit good overlap with the ground truth (Figure 5). Both approaches reported high values in segmentation metrics for both the test (patient-wise Dice Similarity Coefficient (DSC) of 0.738 and tumor-wise DSC of 0.761) and external validation (patient-wise DSC of 0.737 and tumor-wise DSC of 0.760) cohorts (Table 2).
Benchmark to the state-of-the-art
Moreover, we benchmarked our tool with the current best model in the literature [2] and outperformed it in both detection and segmentation tasks. With a precision for liver tumor detection of 28.06%, 82.61% recall, and 0.714 DSC in our test set and 54.03%, 85.47%, and 0.690, respectively, in the external validation cohort (Table 3), SALSA has been proven to benchmark the top-performing model, benefitting from having a larger, more heterogeneous and real-world set of cohorts of liver tumors.
Radiologists’ inter-variability assessment
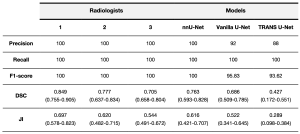
To explore the variability among radiologists in detecting and delineating liver tumors, we randomly selected a group of 25 patients from our test cohort. Three radiologists, blinded to the ground truth, delineated all liver tumors in each case. All outlines created by both the radiologists and the models were measured against a ground truth, specifically, masks segmented manually by the reference expert radiologist (Rad 1), allowing us to assess the intra and inter-variability among radiologists.
Our findings revealed that SALSA's performance in outlining liver tumors (0.763 DSC) was comparable to, or even better than, the level of agreement observed by each of the two blinded radiologists (Rad 2 and Rad 3) used for the inter-radiologists’ variability assessment, obtaining a DSC of 0.777 and 0.703, respectively (Figure 6 and Table 4).
Moreover, for expert validation purposes, a user-friendly web application was developed to allow direct comparison of radiologist preferences between manual segmentations and those generated by the SALSA tool. The application, available at https://radiomics.vhio.net/salsa/, featured the entire liver volume as a scrollable element and allowed for window adjustment and navigation to aid radiologists in accurately evaluating the quality of the contours, depicted over the scan using random colors in order to avoid biasing the choice. Also, a second module for the use of SALSA on any scan is available at the same domain.
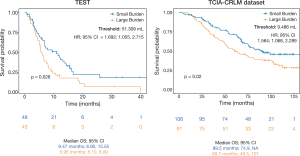
Prognostic power of automatic tumor burden quantification
The prognostic value of liver cancer burden was assessed using the automatic quantification of Total Tumor Volume (TTV) generated by SALSA. Analysis was conducted on data including the test set, 141 patients, and all the cases from the TCIA-CRLM external validation cohort, 197 patients. The association between TTV and clinical outcome in the form of Overall Survival (OS) was studied. The results revealed that a higher liver cancer burden is associated with a poorer prognosis (p=0.028, HR; 95% CI = 1.692; 1.055, 2.715) in both datasets explored (Figure 7).