Study population
The model was developed and validated on 1598 contrast-enhanced CT scans of the liver, coming from 1306 patients with cancer (20% of them without liver tumor burden), accounting for a total of 4908 liver tumors. The images used for the development and testing of the model came from an internal dataset comprised of 885 CT scans from 593 patients, whereas the external validation data was gathered from four independent open-access repositories [2-5] (Figure 1).
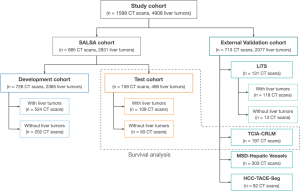
The whole dataset comprises a wide range of images, including both primary and secondary tumors with differing sizes and visual characteristics, helping the model’s ability to generalize. Both datasets exhibit similar distributions in terms of gender, number of liver tumors, percentage of primary liver cancer patients, and disease burden. The patient demographics and clinical characteristics per group are shown in Table 1.
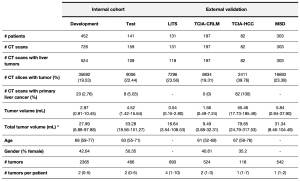
Image preprocessing and model development
A preprocessing pipeline was developed to optimize the training process; it included a cropping around the whole liver with Total Segmentator [6], resampling to 1mm3 voxel size, and applying a padding to the final scan. With the refined dataset three different state-of-the-art DL architectures were trained: Vanilla U-Net [7], nnU-Net [8] and TransUNet [9], to identify the optimal model candidate. They were all evaluated following two approaches: patient-wise evaluation (considering all the tumor burden, volumetric assessment) and tumor-wise evaluation (each individual lesion compared to its corresponding ground truth) the latter being done thanks to graph network analysis.
Performance analysis
To evaluate the performance of the tool, several practical applications were tested. First, the best-performing model was compared to the state-of-the-art, publicly available liver tumor segmentation algorithm. Secondly, a sub-cohort of 25 patients from the test set was re-segmented by three radiologists, enabling us to compare the detection and segmentation performance of the experts with those of the tool. Moreover, a software application was developed in order to assess the radiologists’ preferences between a manual and an automatic contour (https://radiomics.vhio.net/salsa). Lastly, the Total Tumor Volume (TTV) quantification was assessed as a prognostic biomarker (Figure 2).
