In cases where the clinical presentation isn’t sufficient for a conclusive diagnosis, imaging comes in aid with all modalities serving a role. Magnetic resonance imaging (MRI) and computed tomography can both provide a comprehensive and precise evaluation of most, if not all, organ manifestations. Despite their lower specificity and sensitivity (compared to CT and MR), radiography and ultrasound also contribute to this assessment and are excellent in providing first-hand information, for example:
- On a chest X-ray a radiologist can recognize pneumothorax or reticular interstitial pattern and cystic lucencies based on LAM.
 Fig 1: Chest X-ray of a patient whi bilateral reticular interstitial opacities and cystic lucencies.
 Fig 6: Chest X-ray demonstrates an incerted "pigtail" catheter on the left.
The following part aims to present the most common manifestations, organized by the system or organ affected.
Dermatologic manifestations
Cutaneous lesions are rarely evaluated with imaging techniques, but are worth mentioning because they occur in almost 100% of patients and are among the major features of TSC. Hypomelanotic macules (or ash-leaf spots) are the most frequent and often the first clinical “mark” of the disease. [1] Facial angiofibromas are pink/red dome-shaped papules with a characteristic “butterfly” distribution around the nose. Fibrous plaques of the forehead, ungual fibromas and Shagreen patches are additional skin manifestations, less commonly encountered. [2]
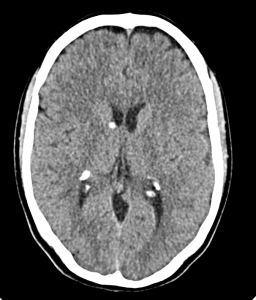
Intracranial manifestations
Cortical (and subcortical) tubers represent benign cortical glioneuronal hamartomas which extend into the underlying white matter and, therefore, can be located anywhere - form cortex to white matter. CT images demonstrate hypoattenuating lesions, that often calcify with the patient’s lifespan. The typical MRI pattern includes low signal intensity on T1-wighted and high signal intensity on T2-wighted images. It is suggested that these findings correlate with clinical neurologic symptoms such as seizures, cognitive impairment and behavioural abnormalities. [1] Subependymal hamartomas are located along the ependymal surface of the lateral ventricles.

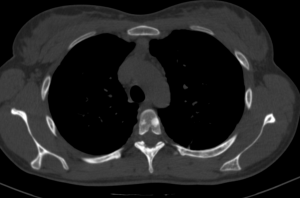
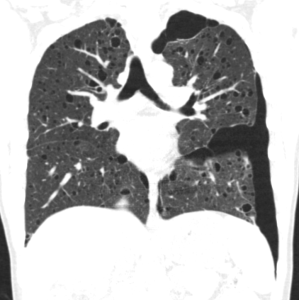
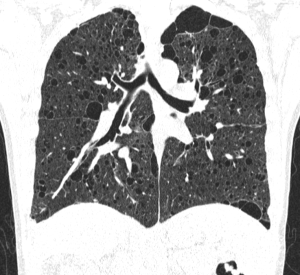
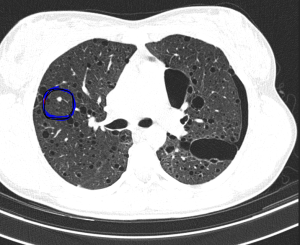
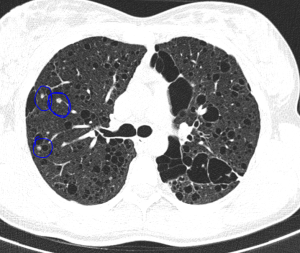
Pulmonary manifestations
The most typical pulmonary manifestation is lymphangioleiomyomatosis (LAM), which occurs as a result of diffuse interstitial proliferation of smooth muscle cells.
Cardiac manifestations
Cardiac rhabdomyomas are benign striated muscle tumors, which present (histologically) with “spider” cells a characteristic feature. These masses can be solitary or multiple and occur in up to 80% of patients. [2] The primary diagnostic tool is US (echocardiography), where they appear as well-defined, hyperechoic, homogeneous masses, predominantly involving the ventricles and the ventricular septum. While asymptomatic in most patients, in some cases they can lead to arrhythmia, valvular dysfunction or cardiac failure. Therefore, such individuals require vigilant follow up. Some data has been published, describing myocardial fat foci as a predictive sign of TSC, even though they aren't part of the diagnostic criteria. They typically arise from the left ventricular wall or the interventricular septum, have low (fat) attenuation on CT and are hyperechoic on US. [1]
Abdominal manifestations
Renal angiomyolipomas (AMLs) are common mesenchymal renal neoplasms, that also frequently present in individuals without TSC association.
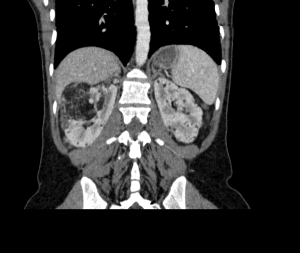
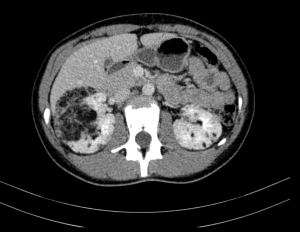
AMLs can also be found in other organs such as the spleen or the liver.
Renal cysts are benign, anechoic lesions (on US), typically multiple and affecting both kidneys. Patients remain asymptomatic, except for ones with the polycystic variation who could exhibit complications like hypertension or renal failure. RCC is a rare manifestation (2-3% of cases), but when associated with TS, it affects younger patients and tends to be less aggressive. The classification includes three main histologic subtypes – papillary, chromophobe, clear cell – which show variable enhancement on CT depending on their vasculature.
Other manifestations worth mentioning include multiple musculoskeletal (sclerotic bone lesions)