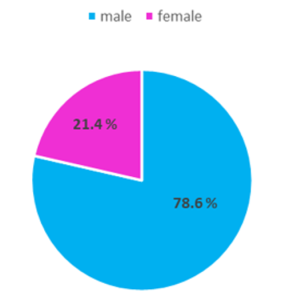
Out of the 70 patients enrolled, 55 were male (78.6%) and 15 were female (21.4%).
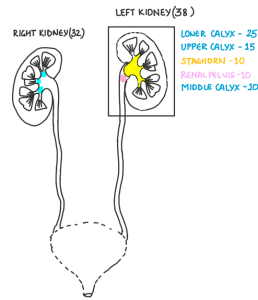
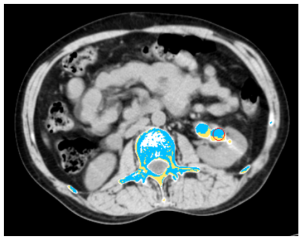
Calculi location and incidence:
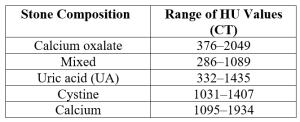
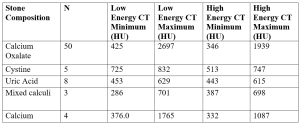
Our study showed that calcium oxalate calculi have the broadest HU range (376–2049). Mixed calculi range from 286 to 1089 HU, while uric acid calculi have a narrower range of 332 to 1435 HU. Cystine calculi range from 1031 to 1407 HU, and calcium calculi show values between 1095 and 1934 HU.
The chemical composition of 50 calculi was calcium oxalate- the most common type (71.4%); 8 calculi were composed of uric acid (11.4%), 5 calculi of Cystine (7.1%) 4 calculi of calcium (5.7%) and 3 calculi of mixed type- uric acid and calcium oxalate (4.3%).

Hounsfield unit (HU) were separately obtained at high attenuation (140 kVp) and low attenuation (80 kVp). These findings were then compared with the findings of biochemical analysis.
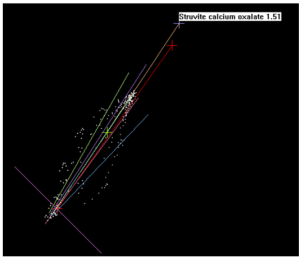
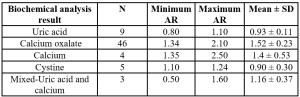
Attenuation ratio (AR) was obtained by separately obtaining HU at high attenuation (140 kvp) and low attenuation (80 kvp). Furthermore, their attenuation ratio was calculated. These findings were then compared to the findings of biochemical analysis. Hence, an AR of < 1.1 with a mean of 0.93 was indicative of uric acid calculi, ratio of > 1.3 with a mean of 1.4 was indicative of calcium calculi, ratios between 1.34- 2.10 with a mean of 1.52 were indicative of calcium oxalate calculi, ratios between 1.1-1.24 with a mean of 0.90 were indicative of cystine calculi and ratio between 0.5-1.6 with a mean of 1.16 were indicative of mixed type calculi.
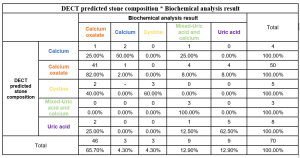
DECT showed a high sensitivity (89.13%) and moderate specificity (62.5%) for calcium oxalate calculi, achieving 80% accuracy. For uric acid calculi, DECT demonstrated moderate sensitivity (55.56%) but high specificity (95.08%), yielding 90% accuracy. Cystine calculi were detected with 100% sensitivity and 97.14% specificity, while mixed composition calculi had lower sensitivity (33.33%) but retained high specificity (100%).