Back to the list
Congress: ECR25
Poster Number: C-25431
Type: Poster: EPOS Radiologist (educational)
DOI: 10.26044/ecr2025/C-25431
Authorblock: S. Morkos, P. Melkonian, R. Abdallah, D. Abou Ltaif, F. H. Farhat, D. G. Jabbour, J. I. Berberi, C. Mourad; Beirut/LB
Disclosures:
Samer Morkos: Nothing to disclose
Patricia Melkonian: Nothing to disclose
Rita Abdallah: Nothing to disclose
Diana Abou Ltaif: Nothing to disclose
Fatima Hassan Farhat: Nothing to disclose
Diana Georges Jabbour: Nothing to disclose
Jessica Imad Berberi: Nothing to disclose
Charbel Mourad: Nothing to disclose
Keywords: Interventional non-vascular, Neuroradiology spine, Radioprotection / Radiation dose, CT, Radiation safety, Geriatrics, Quality assurance, Trauma
Findings and procedure details

The average number of injections per procedure is 1.39, ranging from 1 to 4 injections.

Epidural injections were the most common, totaling 106, followed by facet injections (84) and foraminal injections (38).

The majority of patients received injections at a single vertebral level (152 patients). Seventeen patients received injections at two distinct spinal levels. Two individuals received injections at three distinct spinal levels.

Amongst the patient population included in our study, 12 patients had orthopedic hardware.

The Dose Length Product (DLP) in the study group was significantly lower than in the control group (Table 2; Figure 1).

Table 2: Table displaying the total dose, diagnostic dose, and minimal dose for the study and control groups.

Fig 1: The boxplot depicts the total dosage of the procedure, the dose of the helical acquisition (diagnostic dose), and the minimal dose of the axial acquisition (minimal dose) for the study group (blue) and control group (red).

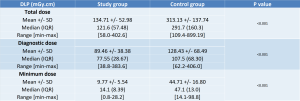
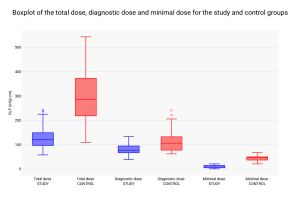
The study group had a mean total DLP of 134.71 mGy.cm, compared to 313.13 mGy.cm in the control group. This equates to a dosage reduction of 56.97%.

The mean DLP for diagnostic acquisitions was 89.46 mGy.cm in the study group against 128.43 mGy.cm in the control group. This equates to a dosage reduction of 30.34%.

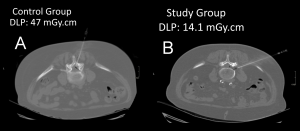
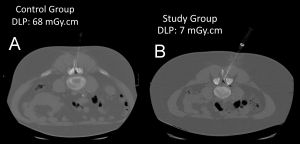
The mean DLP for minimal dose acquisitions was 9.77 mGy.cm in the study group against 44.71 mGy.cm in the control group. This equates to a dosage reduction of 78.4%.

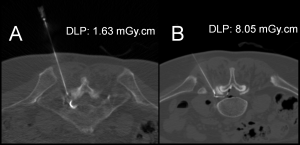
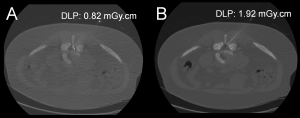
The needle tip visibility did not differ significantly between the two groups (p = 1.0, Chi-square test) (Figures 2, 3, 4, and 5). The needle tip was visible in nearly every patient in this study (170 out of 171).

Fig 2: An example of DLP discrepancies between one patient from the control group (A) and another from the study group (B). Notice how the needle tip is visible in both cases.

Fig 3: Another example of DLP discrepancies between one patient from the control group (A) and another from the study group (B). Notice the visibility of the needle tip in both examples.

Fig 4: An example of appropriate needle tip visibility in a 77-year-old woman receiving a decreased dose (A) on a repeat injection (DLP: 1.63 mGy.cm). In comparison to the prior injection, the usual protocol (B) had a DLP of 8.05 mGy.cm.

Fig 5: (A) Example of poor needle tip visibility due to noise in a 55-year-old woman (DLP: 0.82 mGy.cm). (B) CT was repeated at a slightly higher dose (DLP: 1.92 mGy.cm), with the needle tip visible.

GALLERY