Between January 2018 and December 2023, we examined 2723 consecutive patients with 3T-MRI using three different techniques during a single session.
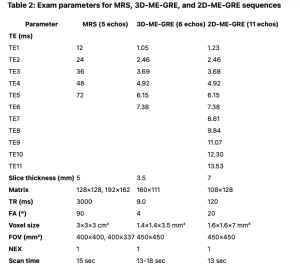
While 1H-MRS uses the difference in frequency between the dominant methylene lipid and water [8], 2D and 3D ME-GRE sequences exploit the difference in phase between water and lipids[5]. Both MR-GRE techniques minimize the effects from T1-relaxation by applying a low flip angle and correct the T2* effect by using different echo times [9]. 2D ME-GRE and 3D ME-GRE differ in their acquisition strategy, spatial coverage, and application scope [10, 11]. Table 2 shows the exam parameters of the three techniques.
LiverLab (Siemens) and MR Quantif are two MRI-based tools that process the proton density fat fraction (PDFF). While both are reliable methods based on chemical shift-encoded MRI, they differ in terms of their methodology, implementation, and features [12-15]. LiverLab is integrated into Siemens MRI systems as a part of their LiverLab application suite. The Workflow is fully embedded in Siemens MRI scanners, providing a seamless experience during data acquisition and analysis [12].
MR Quantif is an independent software tool, compatible with multiple MRI systems (vendor-agnostic). The Platform is stand-alone or post-processing software often used for research or in facilities with various MRI systems. Therefore, its Workflow requires data export from the MRI system for MR Quantif post-processing[14].
Data post-processing
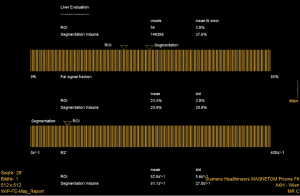
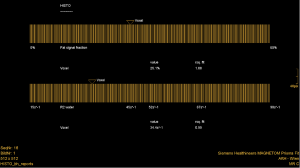
Following automated liver segmentation and ROI positioning in segments V-VI on the 6-echo 3D-GRE liver images, LiverLab (LL) software automatically generates a diagram which shows the percentage of fat and its standard deviation. Similarly, after MRS, LL software automatically generated a spectra and clinical report containing, the percentage of fat for the ROI positioned in segments V-VI. Then the LL results were sent to the PACS for interpretation of the fat screening component.
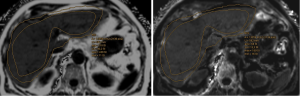
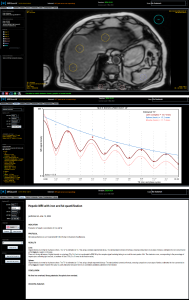
The 11-echo 2D-ME-GRE images were processed with the gratis online semi-automated MRQuantif (MRQ) program from the University of Rennes (France) which requires the following manual ROI placements on a single image: three in the liver, two in the paravertebral muscles, one in the spleen, and one in the background noise. These same ROI positions were automatically transferred to the matching slice for all the other TE sequences.
Quantitative analysis of PDFF
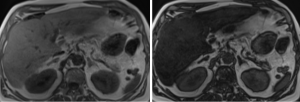
As a standard of reference, manual quantitative image analysis was performed using a picture archiving and communication system (PACS). On a mid-hepatic axial 3D-ME GRE slice, two readers respectively, independently selected an axial slice within the middle third of the liver, on an axial 3D-ME GRE slice, identical to that selected for 2D-ME-GRE slice MRQuantif. They manually drew a single large free-hand volumetric region of interest (VOI) to encompass the liver circumference, avoiding major hilar vessels, bile ducts, liver edges, artifacts and large focal liver lesions to measure PDFF estimates on fat sequence. Finally, the mean FF values from the two readers were averaged and used as the reference measurement.
Semi-automated PDFF in % values generated with MRQ were performed by manually placing three ROIs in the liver, two ROIs in the paravertebral muscles, one ROI in the spleen and one ROI in the image noise. The software then calculates the fat content of the liver. This was performed by the same readers independently.
Then, considering the PDFF values from the large single-slice FH-VOI on 3D-ME-GRE LL as the standard of reference, we compared PDFF values from: (a) semi-automated 2D-ME-GRE MRQ images to the standard of reference, (b) fully-automated volume 3D-ME-GRE LL images to the standard of reference, (c) fully-automated MRS LL images to the standard of reference.
Statistical analysis
All statistical analyses were performed using SPSS 27 or R. Probabilities lower than p < 0.05 were assumed to be significant.