Echo Intensity and MR Fat Fraction
EI and MR %FF Correlation: This study confirmed the relationship between EI and MR %FF, with both operators observing that increased EI correlates with higher MR %FF. The strong inter-operator correlation (0.95) reinforces the reliability of EI measurements, especially for the biceps brachii (BB).
- Operator 1 and Operator 2, as seen per Figure 3, showed comparable measurements in both the RF and BB.
 Fig 3: Results for Operator 1 and Operator 2 RF and BB EI measurements. The red line shows the median values for each group.
Rectus Femoris (RF) vs. Biceps Brachii (BB): EI values were approximately 50% higher in the RF compared to the BB, (Figure 3), suggesting the need for refined protocols for BB measurements.
- Rectus Femoris (RF): EI measurements showed strong correlation between operators and also with the calculated MR %FF, with a strong correlation (r=0.73 and r=0.64) for Operators 1 and 2 respectively, as can be seen in Figures 4 and 5.
 Fig 4: (A) The EI measurements conducted by operator 1 in the RF compared with the calculated percentage of fat fraction using MRI. (B) EI measurements conducted by operator 2 in the RF compared with the calculated percentage of fat fraction using MRI.
 Fig 5: Correlation between operators 1 and 2 and MR %FF calculations. Significant strong correlations were found at RF for operator 1 (r = 0.73) and moderate at RF for operator 2 (r = 0.64).
 - Biceps Brachii (BB): EI measurements were compared for Operator 1 and Operator 2 within the BB. Comparison betweeen Operator 1 and 2 can be seen in Figure 6, and can be seen to be in excellent agreement with eachother. However, these results only showed moderate agreement with MR %FF calculations, Figure 7.
 Fig 6: A) The EI measurements conducted by operator 1 in the BB compared with the calculated percentage of fat fraction using MRI. (B) EI measurements conducted by operator 2 in the BB compared with the calculated percentage of fat fraction using MRI.
 Fig 7: Correlation between operators 1 and 2 and MR %FF calculations. Moderate correlations were found at BB for operator 1 (r = 0.67) and moderate at RF for operator 2 (r = 0.59).
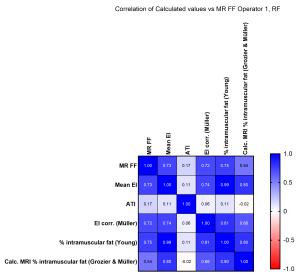
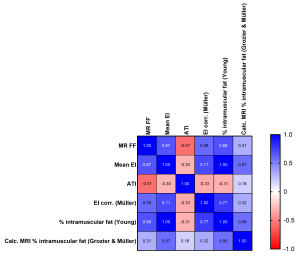
Subcutaneous Fat Tissue (SFT) Confounding Effect: While SFT thickness affects EI (higher SFT reduces EI), applying correction factors (e.g., Müller et al.'s formula5)did not significantly improve correlations with MR %FF. This indicates that correction methods may not be universally applicable due to variations in ultrasound machines, probes, and participant cohorts. The effects of using different correction methods can be seen in Figure 8 and Figure 9.
Attenuation Imaging (ATI):
- ATI, widely used for liver fat assessment, showed no significant correlation with MR %FF or EI in skeletal muscle, Figure 10. This may be due to ATI being optimised for liver tissue and limitations in region of interest (ROI) size for smaller muscles like the RF.
 Fig 10: A) No clear trend is present in the relationship between MR %FF and ATI measurements. (B) Echo intensity was compared with ATI values, and no trend was demonstrated. (C) Echo intensity for operator 2 compared with ATI values, demonstrating no trend.