A prospective multicenter study was conducted with 34 participants (20 female, 14 male, aged 21-88) to compare ultrasound (US) and MRI for assessing muscle quality. Participants underwent whole-body MRI between 2020 and 2024, followed by ultrasound assessments of the rectus femoris (RF) and biceps brachii (BB) muscles in April 2024. Participants were selected based on specific criteria, excluding those with excessive MRI artefacts. Key factors such as age, sex, BMI, alcohol consumption, physical activity, and sarcopenia risk (using the SARC-F questionnaire) were assessed.
MRI Measurements: Whole-body MRI was performed using a 3T scanner (Siemens Magnetom Skyra) with a T1-weighted Dixon VIBE sequence. Fat fraction (MR %FF) was calculated as:
MR %FF = (signal-fat / [signal-water + signal-fat] × 100)
Ultrasound Measurements: A Canon Aplio i800 ultrasound machine with a 7 MHz linear array was used. Standardized settings (gain: 76 dB, dynamic range: 60 dB, TGC) were applied. Attenuation imaging (ATI) was performed with a region of interest (ROI) of 2 x 2 cm and a quality indicator threshold of R² > 0.85. Participants were positioned supine for RF scans and seated for BB scans. Five consecutive measurements were taken per imaging plane, resulting in 15 images per participant (10 RF, 5 BB). Images were anonymized and saved as DICOM files for analysis.
Image Analysis:
-
MRI: Manual tracing of RF and BB muscles was used to calculate MR %FF. MRI images were segmented as per Figure 1.
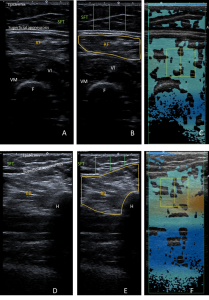
 Fig 1: (A-B) Representative T1-weighted Dixon VIBE MR image tracing the cross-sectional area of the right RF on the fat-based image (left) and water-based image (right). RF = Rectus femoris, VI = Vastus intermedius, VM = Vastus medialis, F = Femur. (C-D) Representative T1-weighted Dixon VIBE MR image tracing the cross-sectional area of the right BB on the fat-based image (left) and water-based image (right). BB = Biceps brachii, H = Humerus
 -
Ultrasound: Echo intensity (EI) was measured using ImageJ software, with pixel intensity ranging from 0 (black) to 255 (white). Subcutaneous fat tissue (SFT) thickness was measured at three points and averaged.
-
A correction factor was applied to EI to account for SFT thickness:
-
EI_corrected = EI_measured + 39.2297 × AT (adipose layer thickness)
-
Two formulas were used to estimate intramuscular fat from ultrasound:
-
-
Young et al.3 (accounting for SFT and EI):MR %FF = [0.093 × (40 × SFT) + RF EI] + 4.698.
-
Grozier et al. 4 (accounting for age and corrected EI):US calculated MR %FF = −3.843 + (0.065 × RF EI_corrected) + (0.145 × age).
Ultrasound images were segmented for measurement as seen in Figure 2.